Monitor Your Server with Tracing Using OpenTelemetry & Prisma

Tracing is a powerful tool that allows you to analyze your application's performance and identify bottlenecks. This tutorial will teach you the core concepts of tracing and how to integrate tracing into your application using OpenTelemetry and Prisma's tracing feature.
Table Of Contents
- Introduction
- Prerequisites
- Clone the repository
- Integrate tracing into your application
- Visualize traces with Jaeger
- Add traces for your Prisma queries
- Set up automatic instrumentation for Express
- Reduce the performance impact of tracing
- Summary and final remarks
Introduction
In this tutorial, you will learn how to integrate tracing into an existing web application built using Prisma and Express. You will implement tracing using OpenTelemetry, a vendor neutral standard for collecting tracing and other telemetry data (e.g., logs, metrics, etc.).
Initially you will create manual traces for an HTTP endpoint and print them to the console. Then you will learn how to visualize your traces using Jaeger. You will also learn how to automatically generate traces for your database queries using Prisma's tracing feature. Finally, you will learn about automatic instrumentation and performance considerations when using tracing.
What is tracing?
Tracing is an observability tool that records the path taken by a request as it propagates through your application(s). Traces help you link the activities that your system is performing in response to any particular request. Traces also provide timing information (e.g., start time, duration, etc.) about these activities.
A single trace gives you information about what happens when a request is made by a user or an application. Each trace is made up of one or more spans, which contain information about a single step or task happening during a request.
Using a tracing tool such as Jaeger, traces can be visualized as diagrams like this:
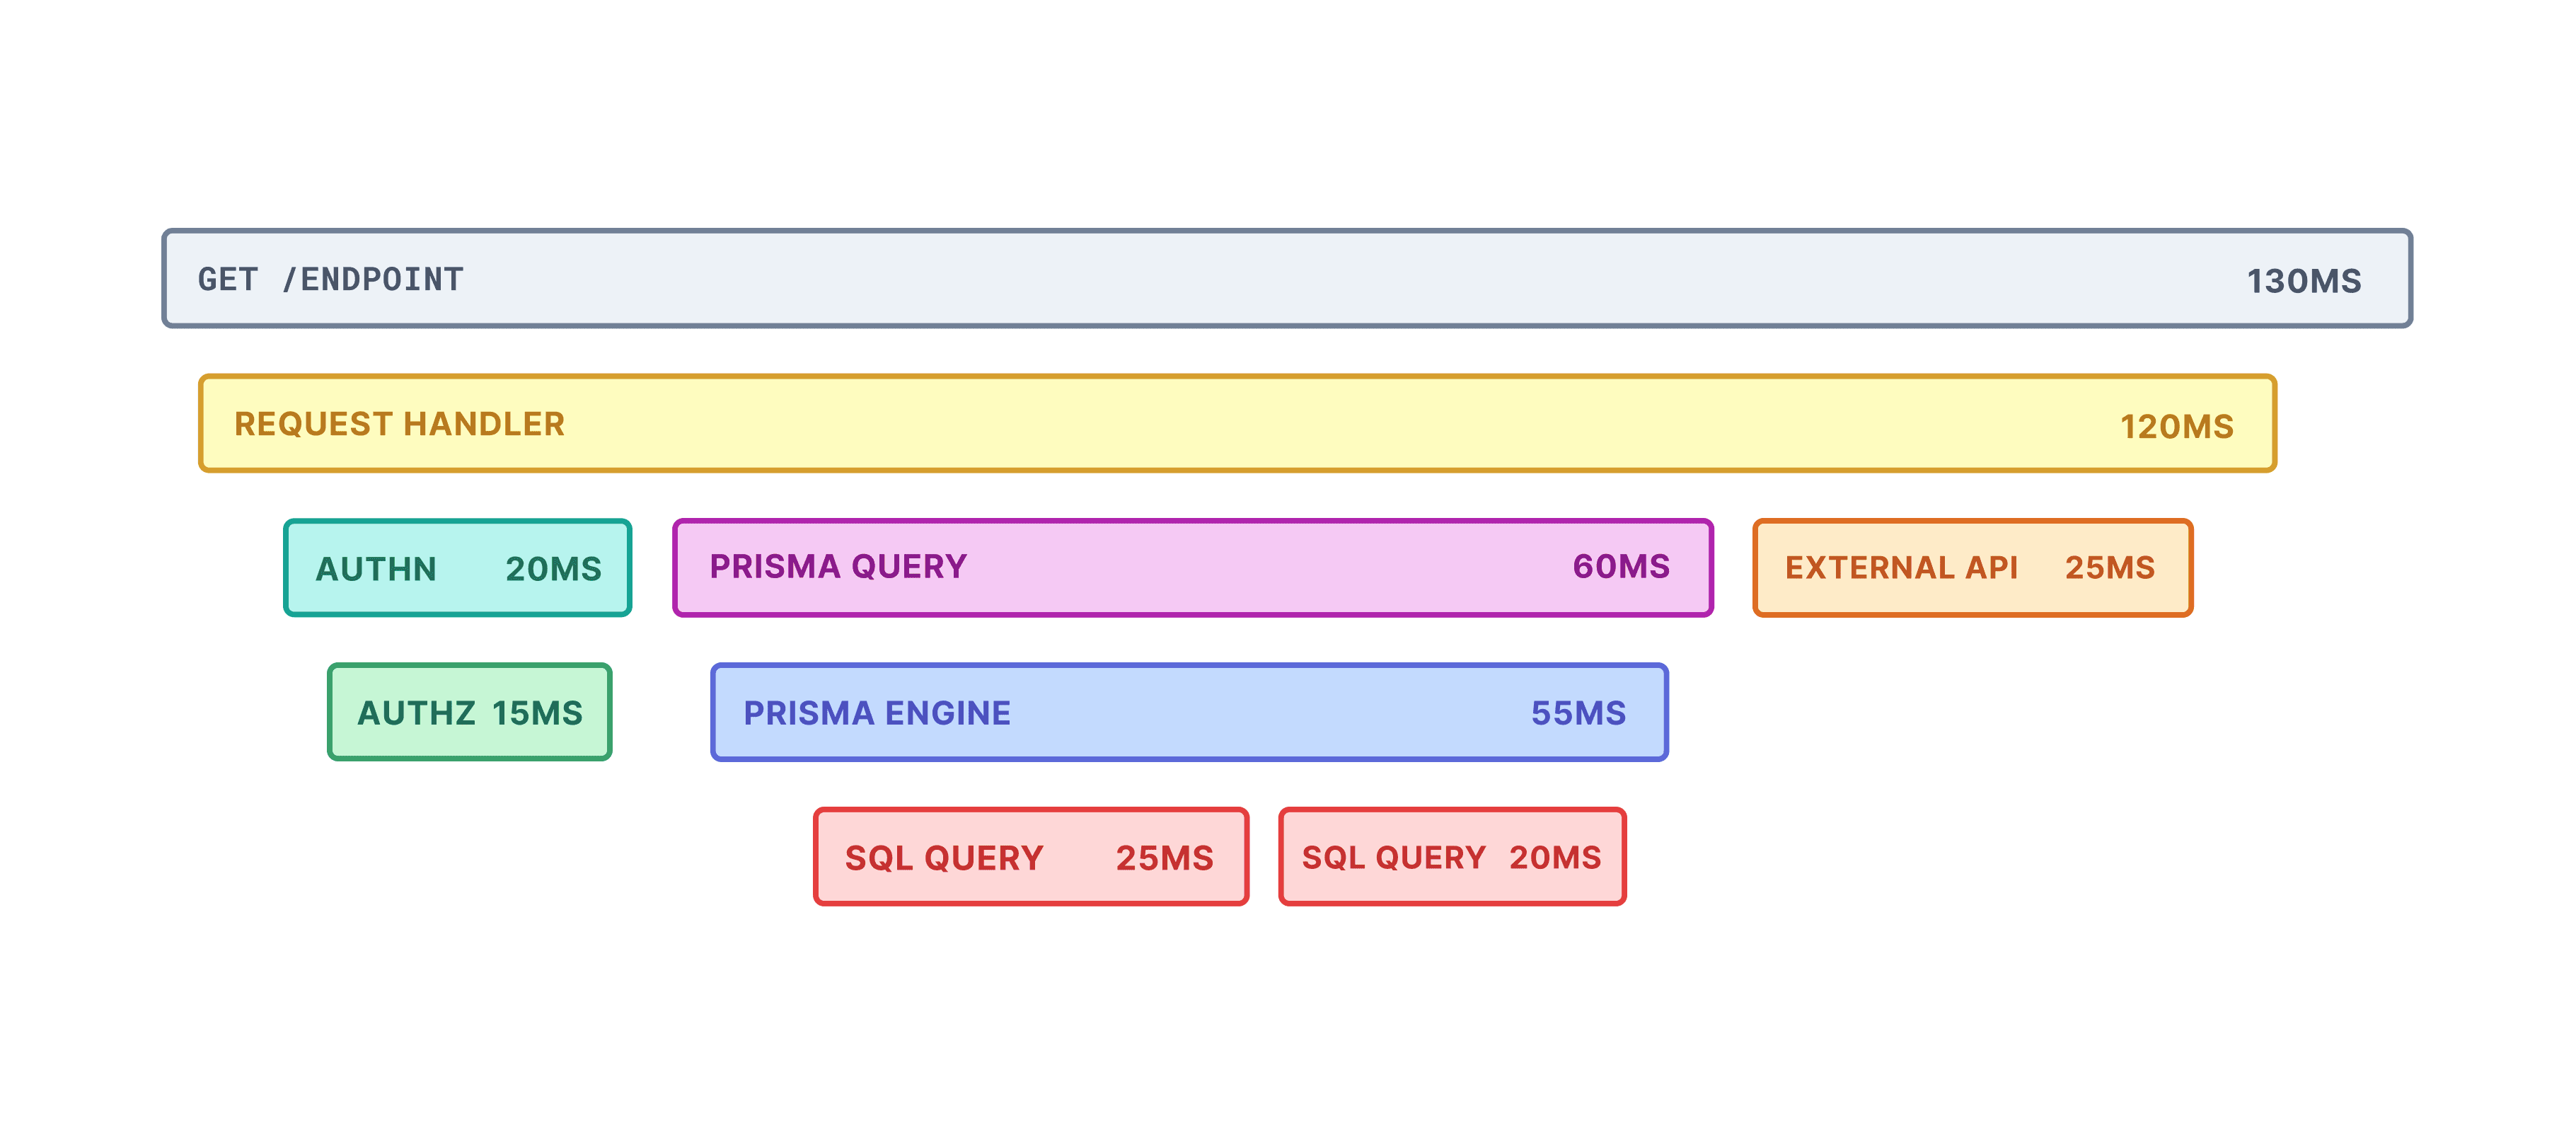
A single span can have multiple child spans, which represent sub-tasks happening during the parent span. For example, in the diagram above, the PRISMA QUERY span has a child span called PRISMA ENGINE. The top-most span is called the root span, representing the entire trace from start to finish. In the diagram above, GET /ENDPOINT is the root span.
Tracing is a fantastic way to gain a deeper understanding and visibility into your system. It lets you precisely identify errors and performance bottlenecks that are impacting your application. Tracing is especially useful for debugging distributed systems, where each request can involve multiple services, and specific issues can be difficult to reproduce locally.
Note: Tracing is often combined with metrics to get better observability of your system. To learn more about metrics, take a look at our metrics tutorial.
Technologies you will use
You will be using the following tools in this tutorial:
- OpenTelemetry as the tracing library/API
- Prisma as the Object-Relational Mapper (ORM)
- SQLite as the database
- Jaeger as the tracing visualization tool
- Express as the web framework
- TypeScript as the programming language
Prerequisites
Assumed knowledge
This is a beginner friendly tutorial. However, this tutorial assumes:
- Basic knowledge of JavaScript or TypeScript (preferred)
- Basic knowledge of backend web development
Note: This tutorial assumes no prior knowledge about tracing and observability.
Development environment
To follow along with this tutorial, you will be expected to:
- ... have Node.js installed.
- ... have Docker and Docker Compose installed.
- ... optionally have the Prisma VS Code Extension installed. The Prisma VS Code extension adds some really nice IntelliSense and syntax highlighting for Prisma.
- ... optionally have access to a Unix shell (like the terminal/shell in Linux and macOS) to run the commands provided in this series.
If you don't have a Unix shell (for example, you are on a Windows machine), you can still follow along, but the shell commands may need to be modified for your machine.
Clone the repository
You will need a web application to use when demonstrating tracing. You can use an existing Express web application we built for this tutorial.
To get started, perform the following actions:
- Clone the repository:
- Navigate to the cloned directory:
- Install dependencies:
- Apply database migrations from the
prisma/migrationsdirectory:
Note: This command will also generate Prisma Client and seed the database.
- Start the project:
Note: You should keep the server running as you develop the application. The
devscript should restart the server any time there is a change in the code.
The application has only one endpoint: http://localhost/users/random. This endpoint will return a random sample of 10 users from the database. Test out the endpoint by going to the URL above or by running the following command:
curl http://localhost:4000/users/randomProject structure and files
The repository you cloned has the following structure:
tracing-tutorial-prisma
  ├── README.md
  ├── package-lock.json
  ├── package.json
  ├── node_modules
  ├── prisma
  │   ├── dev.db
  │   ├── migrations
  │   │   ├── 20220802113053_init
  │   │   │   └── migration.sql
  │   │   └── migration_lock.toml
  │   ├── schema.prisma
  │   └── seed.ts
  ├── server.ts
  └── tsconfig.json
The notable files and directories in this repository are:
prismaschema.prisma: Defines the database schema.migrations: Contains the database migration history.seed.ts: Contains a script to seed your development database with dummy data.dev.db: Stores the state of the SQLite database.
server.ts: The Express server with theGET /users/randomendpoint.tsconfig.json&package.json: Configuration files.
Integrate tracing into your application
Your Express application has all of the core "business logic" already implemented (i.e. returning 10 random users). To measure performance and improve the observability of your application, you will integrate tracing.
In this section, you will learn how to initialize tracing and create traces manually.
Initialize tracing
You will implement tracing using OpenTelemetry tracing. OpenTelemetry provides an open source implementation that is compatible across a wide range of platforms and languages. Furthermore, it comes with libraries and SDKs to implement tracing.
Get started with tracing by installing the following OpenTelemetry packages:
npm install --save @opentelemetry/api
npm install --save @opentelemetry/sdk-trace-node
These packages contain the Node.js implementation of OpenTelemetry tracing.
Now, create a new tracing.ts file to initialize tracing:
touch tracing.tsInside tracing.ts, initialize tracing as follows:
// tracing.ts

import { Resource } from "@opentelemetry/resources";
import { SemanticResourceAttributes } from "@opentelemetry/semantic-conventions";
import { SimpleSpanProcessor, ConsoleSpanExporter } from "@opentelemetry/sdk-trace-base";
import { NodeTracerProvider } from "@opentelemetry/sdk-trace-node";
import { trace, Tracer } from "@opentelemetry/api";

export default function initializeTracing(serviceName: string): Tracer {
    const provider = new NodeTracerProvider({
        resource: new Resource({
            [SemanticResourceAttributes.SERVICE_NAME]: serviceName,
        }),
    });

    const consoleExporter = new ConsoleSpanExporter()
    provider.addSpanProcessor(new SimpleSpanProcessor(consoleExporter));

    provider.register();

    return trace.getTracer(serviceName);
};
The initializeTracing function does a few things:
- It initializes a tracer provider, which is used to create tracers. A tracer creates traces/spans inside your application.
- It defines a trace exporter and adds it to your provider. Trace exporters send traces to a variety of destinations. In this case, the
ConsoleSpanExporterprints traces to the console. - It registers the provider for use with the OpenTelemetry API by calling the
.register()function. - Finally, it creates and returns a tracer with a given name passed as an argument to the function.
Now, import and call initializeTracing in the existing server.ts:
diff // server.ts

// initialize tracing
+import initializeTracing from "./tracing";
+const tracer = initializeTracing("express-server")

import { PrismaClient } from "@prisma/client";
import express, { request, Request, response, Response } from "express";

const app = express();
const port = 4000;

const prisma = new PrismaClient({});

app.get("/users/random", async (_req: Request, res: Response) => {
  // ... request handler implementation
});


app.listen(port, () => {
    console.log(`Example app listening on port ${port}`);
});
Now you are ready to create your first trace!
Create your first trace
In the previous section, you initialized tracing and imported a tracer to your server. Now you can use the tracer object to create spans inside your server. First, you will create a trace encapsulating the GET /users/random request. Update the request handler definition as follows:
diff // server.ts

app.get("/users/random", async (_req: Request, res: Response) => {
+     await tracer.startActiveSpan("GET /users/random", async (requestSpan) => {
        try {
            let users = await prisma.user.findMany({
                include: {
                    posts: true
                }
            });

            // select 10 users randomly
            const shuffledUsers = users.sort(() => 0.5 - Math.random());
            const selectedUsers = shuffledUsers.slice(0, 10);

+            requestSpan.setAttribute("http.status", 200);
            res.status(200).json(selectedUsers);
        } catch (e) {
+            requestSpan.setAttribute("http.status", 500);
            res.status(500).json({ error: 500, details: e });
+        } finally {
+             requestSpan.end();
        }
    });
});
Here you are creating a new span using startActiveSpan() and enclosing all of the request handler logic inside the callback function it provides. The callback function comes with a reference to the span object, which you have named requestSpan. You can use it to modify or add attributes to the span. In this code, you set an attribute called http.status to the span based on the outcome of the request. Finally, once the request has been served, you end the span.
To see your newly created span, go to http://localhost/users/random. Alternatively, you can run the following inside the terminal:
curl http://localhost:4000/users/randomGo to the terminal window that is running the Express server. You should see an object similar to the following printed to the console:
{
  traceId: 'a587fce9d4b5012a599368515ad225af',
  parentId: undefined,
  name: 'GET /users/random',
  id: '35545fabe42328d9',
  kind: 0,
  timestamp: 1661018023898603,
  duration: 25268,
  attributes: { 'http.status': 200 },
  status: { code: 0 },
  events: [],
  links: []
}
This object represents the span you have just created. Some of the notable properties here are:
idrepresents a unique identifier for this particular span.traceIdrepresents a unique identifier for a particular trace. All spans in a certain trace will have the spaintraceId. Right now, your trace consists of only a single span.parentIdis theidof the parent span. In this case, it isundefinedbecause the root span does not have a parent span.namerepresents the name of the span. You specified this when you created the span.timestampis a UNIX timestamp representing the span creation time.durationis the duration of the span in microseconds.
Visualize traces with Jaeger
Currently, you are viewing traces in the console. While this is manageable for a single trace, it is not very useful for a large number of traces. To better understand your traces, you will need some tracing solution that can visualize traces. In this tutorial, you will use Jaeger for this purpose.
Set up Jaeger
You can set up Jaeger in two ways:
In this tutorial, you will use Docker Compose to run the Docker image of Jaeger. First, create a new docker-compose.yml file:
touch docker-compose.ymlDefine the following service inside the file:
# docker-compose.yml

version: "3"
services:
  tracing:
    image: jaegertracing/all-in-one:1.35
    environment:
      COLLECTOR_OTLP_ENABLED: "true"
      COLLECTOR_ZIPKIN_HOST_PORT: ":9411"
    ports:
      - 6831:6831/udp
      - 6832:6832/udp
      - 5778:5778
      - 16686:16686
      - 4317:4317
      - 4318:4318
      - 14250:14250
      - 14268:14268
      - 14269:14269
      - 9411:9411
Running this image will set up and initialize all necessary components of Jaeger inside a Docker container. To run Jaeger, open a new terminal window and run the following command in the main folder of your project:
docker-compose upNote: If you close the terminal window running the docker container, it will also stop the container. You can avoid this if you add a
-doption to the end of the command, like this:docker-compose up -d.
If everything goes smoothly, you should be able to access Jaeger at http://localhost.
Since your application is not yet sending traces to Jaeger, the Jaeger UI will be empty.
Add the Jaeger trace exporter
To see your traces in Jaeger, you will need to set up a new trace exporter that will send traces from your application to Jaeger (instead of just printing them to the console).
First, install the exporter package in your project:
npm install @opentelemetry/exporter-jaegerNow add the exporter to tracing.ts:
diff // tracing.ts

import { Resource } from "@opentelemetry/resources";
import { SemanticResourceAttributes } from "@opentelemetry/semantic-conventions";
import { SimpleSpanProcessor, ConsoleSpanExporter } from "@opentelemetry/sdk-trace-base";
import { NodeTracerProvider } from "@opentelemetry/sdk-trace-node";
import { trace, Tracer } from "@opentelemetry/api";
+import { JaegerExporter } from "@opentelemetry/exporter-jaeger";

export default function initializeTracing(serviceName: string): Tracer {
    const provider = new NodeTracerProvider({
        resource: new Resource({
            [SemanticResourceAttributes.SERVICE_NAME]: serviceName,
        }),
    });

-    const consoleExporter = new ConsoleSpanExporter()
+    const jaegerExporter = new JaegerExporter({
+        endpoint: "http://localhost:14268/api/traces",
+    });

-    provider.addSpanProcessor(new SimpleSpanProcessor(consoleExporter));
+    provider.addSpanProcessor(new SimpleSpanProcessor(jaegerExporter));

    provider.register();

    return trace.getTracer(serviceName);
};
Here you initialized a new JaegerExporter and added it to your tracer provider. The endpoint property in the JaegerExporter constructor points to the location where Jaeger is listening for trace data. You also removed the console exporter as it was no longer needed.
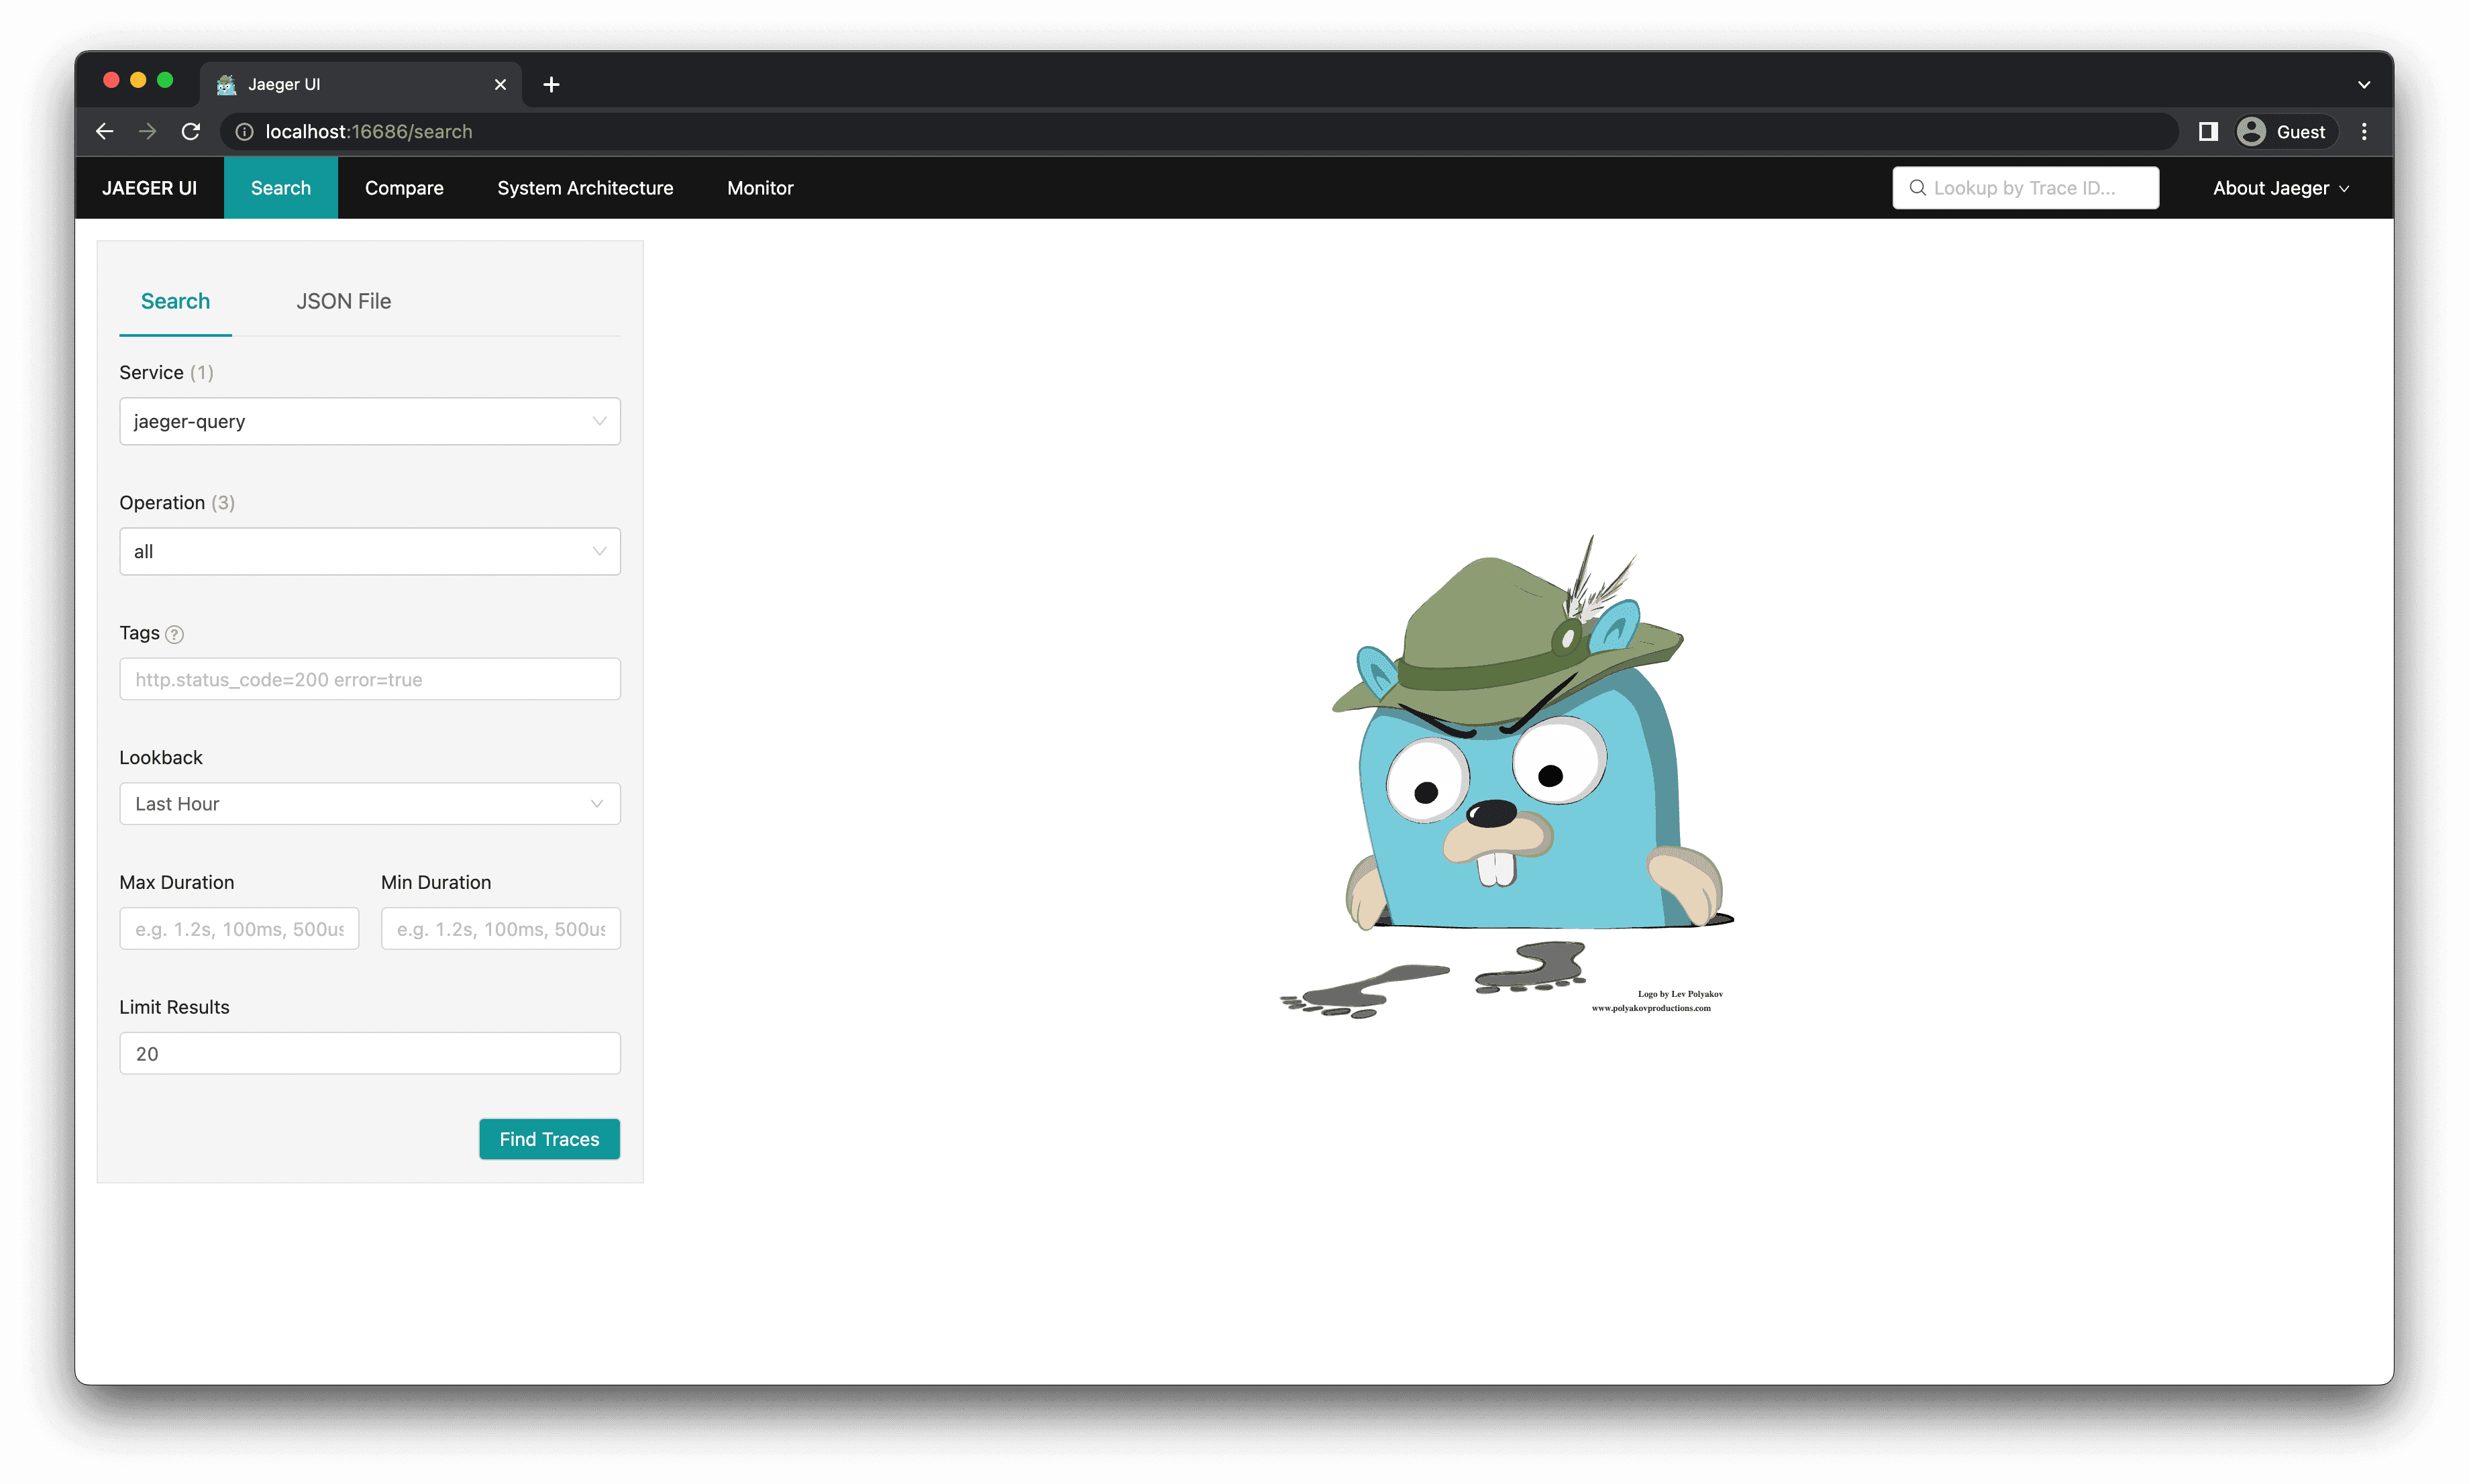
You should now be able to see your traces in Jaeger. To see your first trace:
- Query the
GET /users/randomendpoint again (curl http://localhost:4000/users/random). - Go to http://localhost.
- In the left-hand Search tab, in the Service drop-down, select express-server.
- Near the bottom of the Search tab, click Find Traces.
- You should now see a list of traces. Click on the first trace in the list.
- You will see a detailed view of the trace. There should be a single span called GET /users/random. Click on the span to get more information.
- You should be able to see various bits of information about the trace, such as the Duration and Start Time. You should also see multiple Tags, one of which you set manually (
http.status).
Add traces for your Prisma queries
In this section, you will learn how to trace your database queries. Initially, you will do this manually by creating the spans yourself. Even though manual tracing is no longer necessary with Prisma, implementing manual tracing will give you a better understanding of how tracing works.
Then you will use the new tracing feature in Prisma to do the same automatically.
Manually trace your Prisma queries
To trace your Prisma queries manually, you have to wrap each query in a span. You can do this by adding the following code to your server.ts file:
diff // server.ts

import initializeTracing from "./tracing";
const tracer = initializeTracing("express-server")

-import { PrismaClient } from "@prisma/client";
+import { Post, User, PrismaClient } from "@prisma/client";
import express, { Request, Response } from "express";

// ...

app.get("/users/random", async (_req: Request, res: Response) => {
    await tracer.startActiveSpan("GET /users/random", async (requestSpan) => {
        try {
            // define "users" along with its type.
+            let users: (User & { posts: Post[]; })[] | undefined;
+            await tracer.startActiveSpan("prisma.user.findmany", async (findManyQuerySpan) => {
+                try {
-                    let users = await prisma.user.findMany({
+                    users = await prisma.user.findMany({
                        include: {
                            posts: true
                        }
                    });
+                } finally {
+                    findManyQuerySpan.end()
+                }
+            });

+            if (!users) {
+                throw new Error("Failed to fetch users");
+            }

            // select 10 users randomly
            const shuffledUsers = users.sort(() => 0.5 - Math.random());
            const selectedUsers = shuffledUsers.slice(0, 10);

            res.status(200).json(selectedUsers);
            requestSpan.setAttribute("http.status", 200);
        } catch (e) {
            requestSpan.setAttribute("http.status", 500);
            res.status(500).json({ error: 500, details: e });
        } finally {
            requestSpan.end();
        }
    });
});

// ...
You have created a new span called prisma.user.findmany for the Prisma query. You have also made some changes to how the users variable is declared so that it remains consistent with the rest of your code.
Test out the new span by querying the GET /users/random endpoint again (curl http://localhost:4000/users/random) and viewing the newly generated trace in Jaeger.
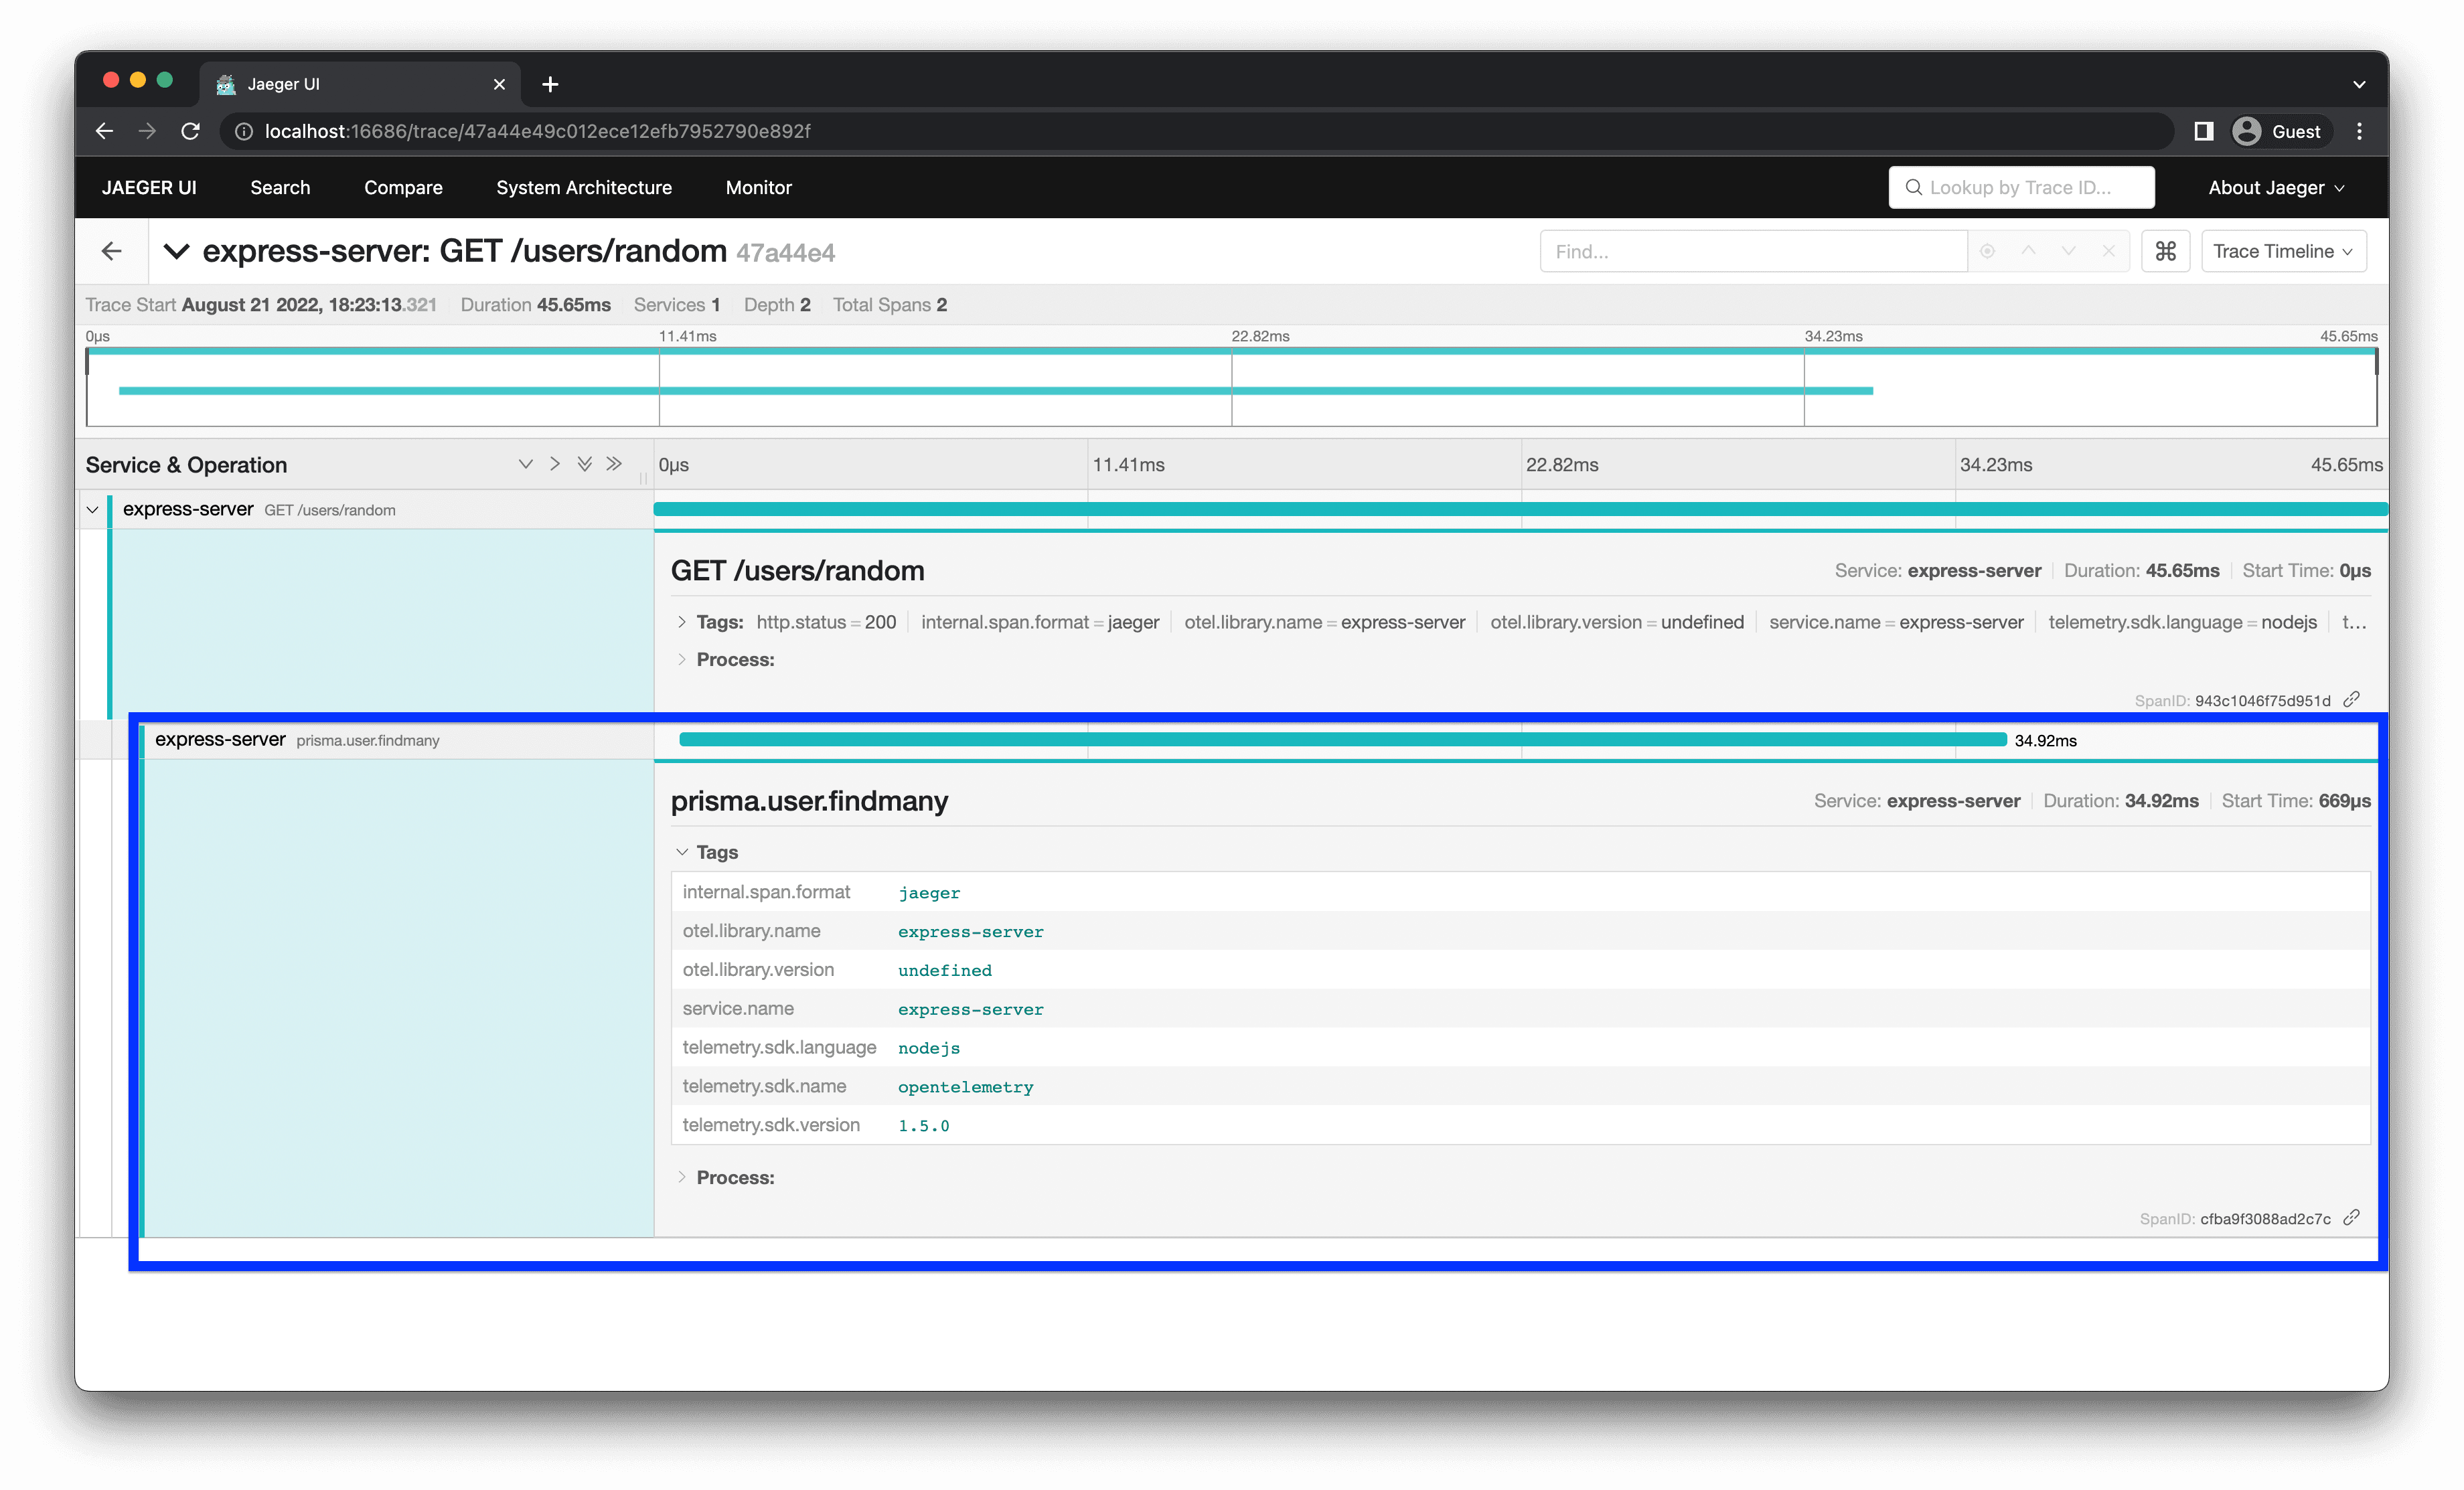
You should see that the generated trace has a new child span called prisma.user.findmany nested under the parent GET /users/random span. Now you can see what duration of the request was spent performing the Prisma query.
Manual vs. automatic instrumentation
So far, you have learned how to set up tracing and manually generate traces and spans for your application. Manually defining spans like this is called manual instrumentation. Manual instrumentation gives you complete control over how your application is traced, however, it has certain disadvantages:
- It is very time-consuming to manually trace your application, especially if your application is large.
- It is not always possible to properly instrument third-party libraries manually. For example, it is not possible to trace the execution of Prisma's internal components with manual instrumentation.
- It can lead to bugs and errors (e.g., improper error handling, broken spans, etc.) as it involves writing a lot of code manually.
Fortunately, many frameworks and libraries provide automatic instrumentation, allowing you to generate traces for those components automatically. Automatic instrumentation requires little to no code changes, is very quick to set up and can provide you with basic telemetry out of the box.
It's important to note that automatic and manual instrumentation are not mutually exclusive. It can be beneficial to use both techniques at the same time. Automatic instrumentation can provide good baseline telemetry with high coverage across all your endpoints. Manual instrumentation can then be added for specific fine-grained traces and custom metrics/metadata.
Set up automatic instrumentation for Prisma
This section will teach you how to set up automatic instrumentation for Prisma using the new tracing feature. To get started, enable the tracing feature flag in the generator block of your schema.prisma file:
diff // schema.prisma
generator client {
  provider        = "prisma-client-js"
+  previewFeatures = ["tracing"]
}

datasource db {
  provider = "sqlite"
  url      = "file:./dev.db"
}

model Post {
  id          String  @id
  description String?
  userId      String
  user        User    @relation(fields: [userId], references: [id])
}

model User {
  id    String @id
  name  String
  posts Post[]
}Note: Tracing is currently a Preview feature. This is why you have to add the
tracingfeature flag before you can use tracing.
Now, regenerate Prisma Client:
npx prisma generate clientTo perform automatic instrumentation, you also need to install two new packages with npm:
npm install @opentelemetry/instrumentation @prisma/instrumentationThese packages are needed because:
@opentelemetry/instrumentationis required to set up automatic instrumentation.@prisma/instrumentationprovides automatic instrumentation for Prisma Client.
According to OpenTelemetry terminology, an instrumented library is the library or package for which one gather traces. On the other hand, the instrumentation library is the library that generates the traces for a certain instrumented library. In this case, Prisma Client is the instrumented library and @prisma/instrumentation is the instrumentation library.
Now you need to register Prisma Instrumentation with OpenTelemetry. To do this, add the following code to your tracing.ts file:
diff // tracing.ts

import { Resource } from "@opentelemetry/resources";
import { SemanticResourceAttributes } from "@opentelemetry/semantic-conventions";
import { SimpleSpanProcessor, ConsoleSpanExporter } from "@opentelemetry/sdk-trace-base";
import { NodeTracerProvider } from "@opentelemetry/sdk-trace-node";
import { trace, Tracer } from "@opentelemetry/api";
import { JaegerExporter } from "@opentelemetry/exporter-jaeger";
+import { registerInstrumentations } from "@opentelemetry/instrumentation";
+import { PrismaInstrumentation } from '@prisma/instrumentation';

export default function initializeTracing(serviceName: string): Tracer {
    const provider = new NodeTracerProvider({
        resource: new Resource({
            [SemanticResourceAttributes.SERVICE_NAME]: serviceName,
        }),
    });

    const jaegerExporter = new JaegerExporter({
        endpoint: "http://localhost:14268/api/traces",
    });

    provider.addSpanProcessor(new SimpleSpanProcessor(jaegerExporter));

+    registerInstrumentations({
+        instrumentations: [
+            new PrismaInstrumentation()
+        ],
+        tracerProvider: provider,
+    });

    provider.register();

    return trace.getTracer(serviceName);
};
The registerInstrumentations call takes two arguments:
instrumentationsaccepts an array of all the instrumentation libraries you want to register.tracerProvideraccepts the tracer provider for your tracer(s).
Since you are setting up automatic instrumentation, you no longer need to create spans for Prisma queries manually. Update server.ts by getting rid of the manual span for your Prisma query:
// server.ts

import initializeTracing from "./tracing";
const tracer = initializeTracing("express-server")

import { PrismaClient } from "@prisma/client";
import express, { Request, Response } from "express";

const app = express();
const port = 4000;

app.get("/users/random", async (_req: Request, res: Response) => {
    await tracer.startActiveSpan("GET /users/random", async (requestSpan) => {
        try {
            let users = await prisma.user.findMany({
                include: {
                    posts: true
                }
            });

            // select 10 users randomly
            const shuffledUsers = users.sort(() => 0.5 - Math.random());
            const selectedUsers = shuffledUsers.slice(0, 10);

            res.status(200).json(selectedUsers);
            requestSpan.setAttribute("http.status", 200);
        } catch (e) {
            requestSpan.setAttribute("http.status", 500);
            res.status(500).json({ error: 500, details: e });
        } finally {
            requestSpan.end();
        }
    });
});

// ...
When using automatic instrumentation, the order in which you initialize tracing matters. You need to set up tracing and register instrumentation before importing instrumented libraries. In this case, the initializeTracing call has to come before the import statement for PrismaClient.
Once again, make a request to the GET /users/random endpoint and see the generated trace in Jaeger.
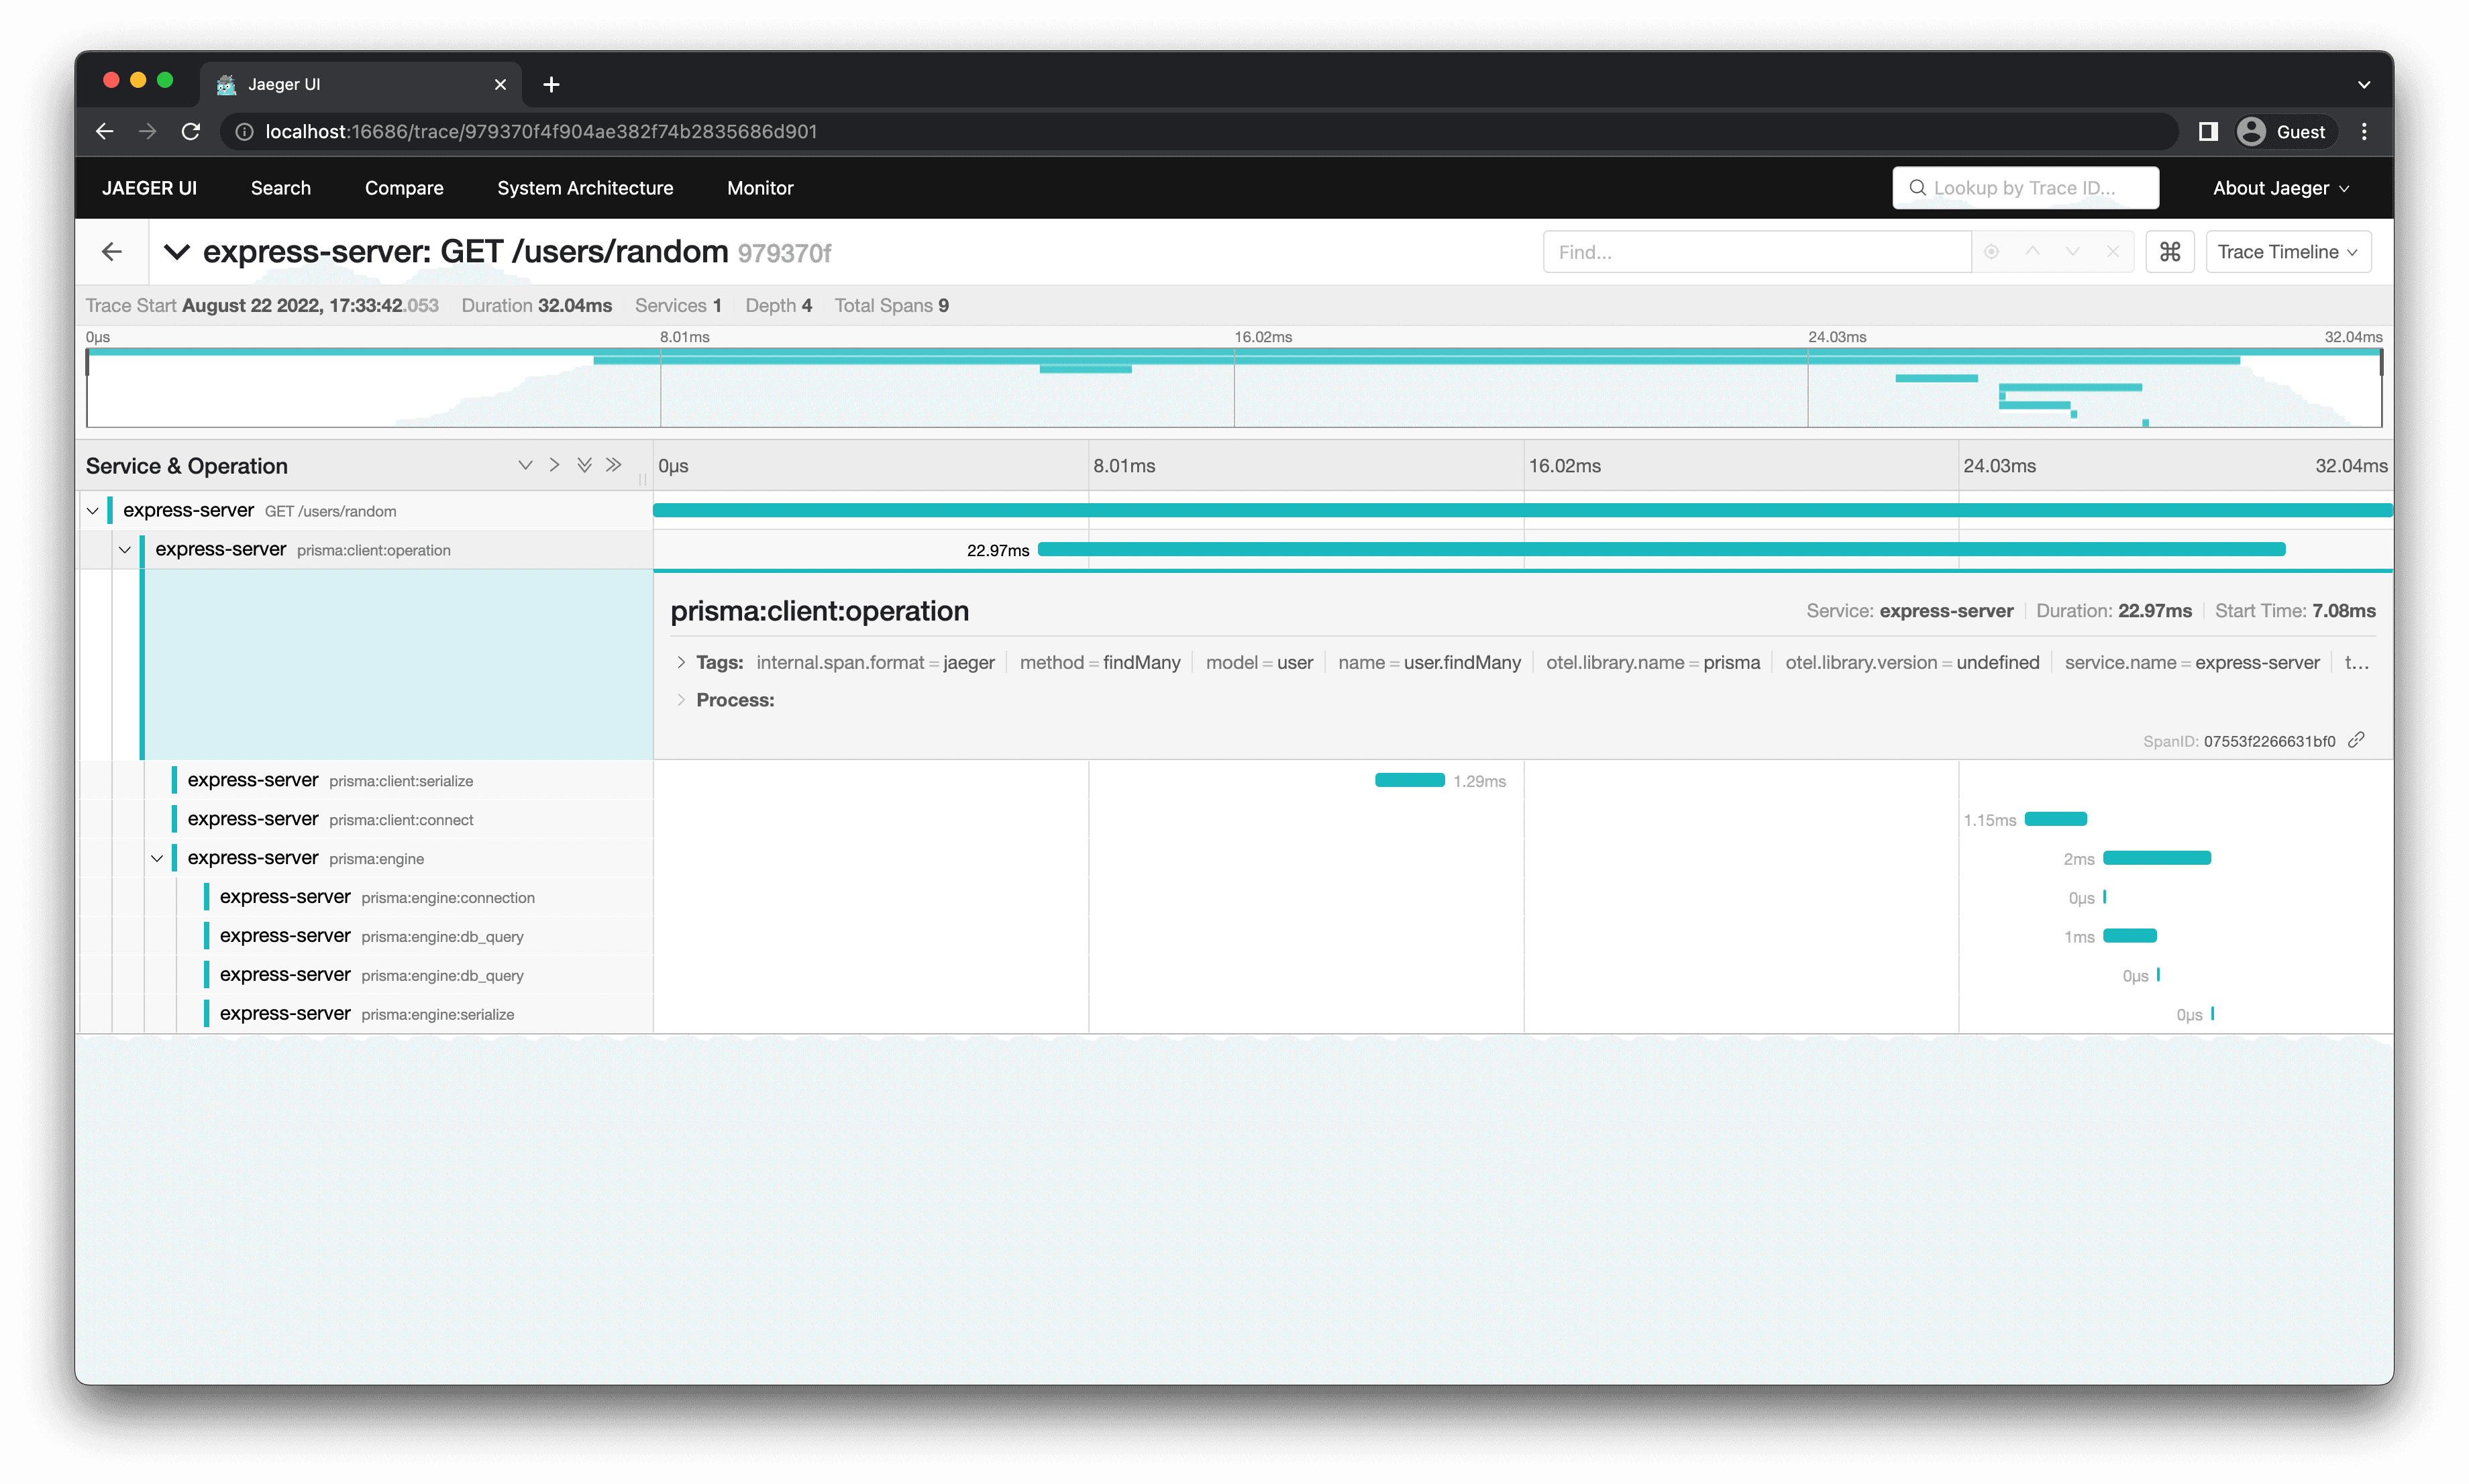
This time, the same Prisma query generates multiple spans, providing much more granular information about the query. With automatic instrumentation enabled, any other query you add to your application will also automatically generate traces.
Note: To learn more about the spans generated by Prisma, see the trace output section of the tracing docs.
Set up automatic instrumentation for Express
Currently, you are tracing your endpoints by manually creating spans. Just like with Prisma queries, manual tracing will become unmanageable as the number of endpoints grows. To address this problem, you can set up automatic instrumentation for Express as well.
Get started by installing the following instrumentation libraries:
npm install @opentelemetry/instrumentation-express @opentelemetry/instrumentation-httpInside tracing.ts register these two new instrumentation libraries:
diff //tracing.ts

// ... imports
+import { ExpressInstrumentation } from '@opentelemetry/instrumentation-express'
+import { HttpInstrumentation } from '@opentelemetry/instrumentation-http'

export default function initializeTracing(serviceName: string): Tracer {
    const provider = new NodeTracerProvider({
        resource: new Resource({
            [SemanticResourceAttributes.SERVICE_NAME]: serviceName,
        }),
    });

    const jaegerExporter = new JaegerExporter({
        endpoint: "http://localhost:14268/api/traces",
    });

    provider.addSpanProcessor(new SimpleSpanProcessor(jaegerExporter));

    registerInstrumentations({
        instrumentations: [
+            new HttpInstrumentation(),
+            new ExpressInstrumentation(),
            new PrismaInstrumentation()
        ],
        tracerProvider: provider,
    });

    provider.register();

    return trace.getTracer(serviceName);
};
Finally, remove the manual span for the GET /users/random endpoint in server.ts:
// ...

app.get("/users/random", async (_req: Request, res: Response) => {
    try {
        let users = await prisma.user.findMany({
            include: {
                posts: true
            }
        });

        // select 10 users randomly
        const shuffledUsers = users.sort(() => 0.5 - Math.random());
        const selectedUsers = shuffledUsers.slice(0, 10);

        res.status(200).json(selectedUsers);
    } catch (e) {
        res.status(500).json({ error: 500, details: e });
    } finally {
    }
});

// ...
Make a request to the GET /users/random endpoint and see the generated trace in Jaeger.
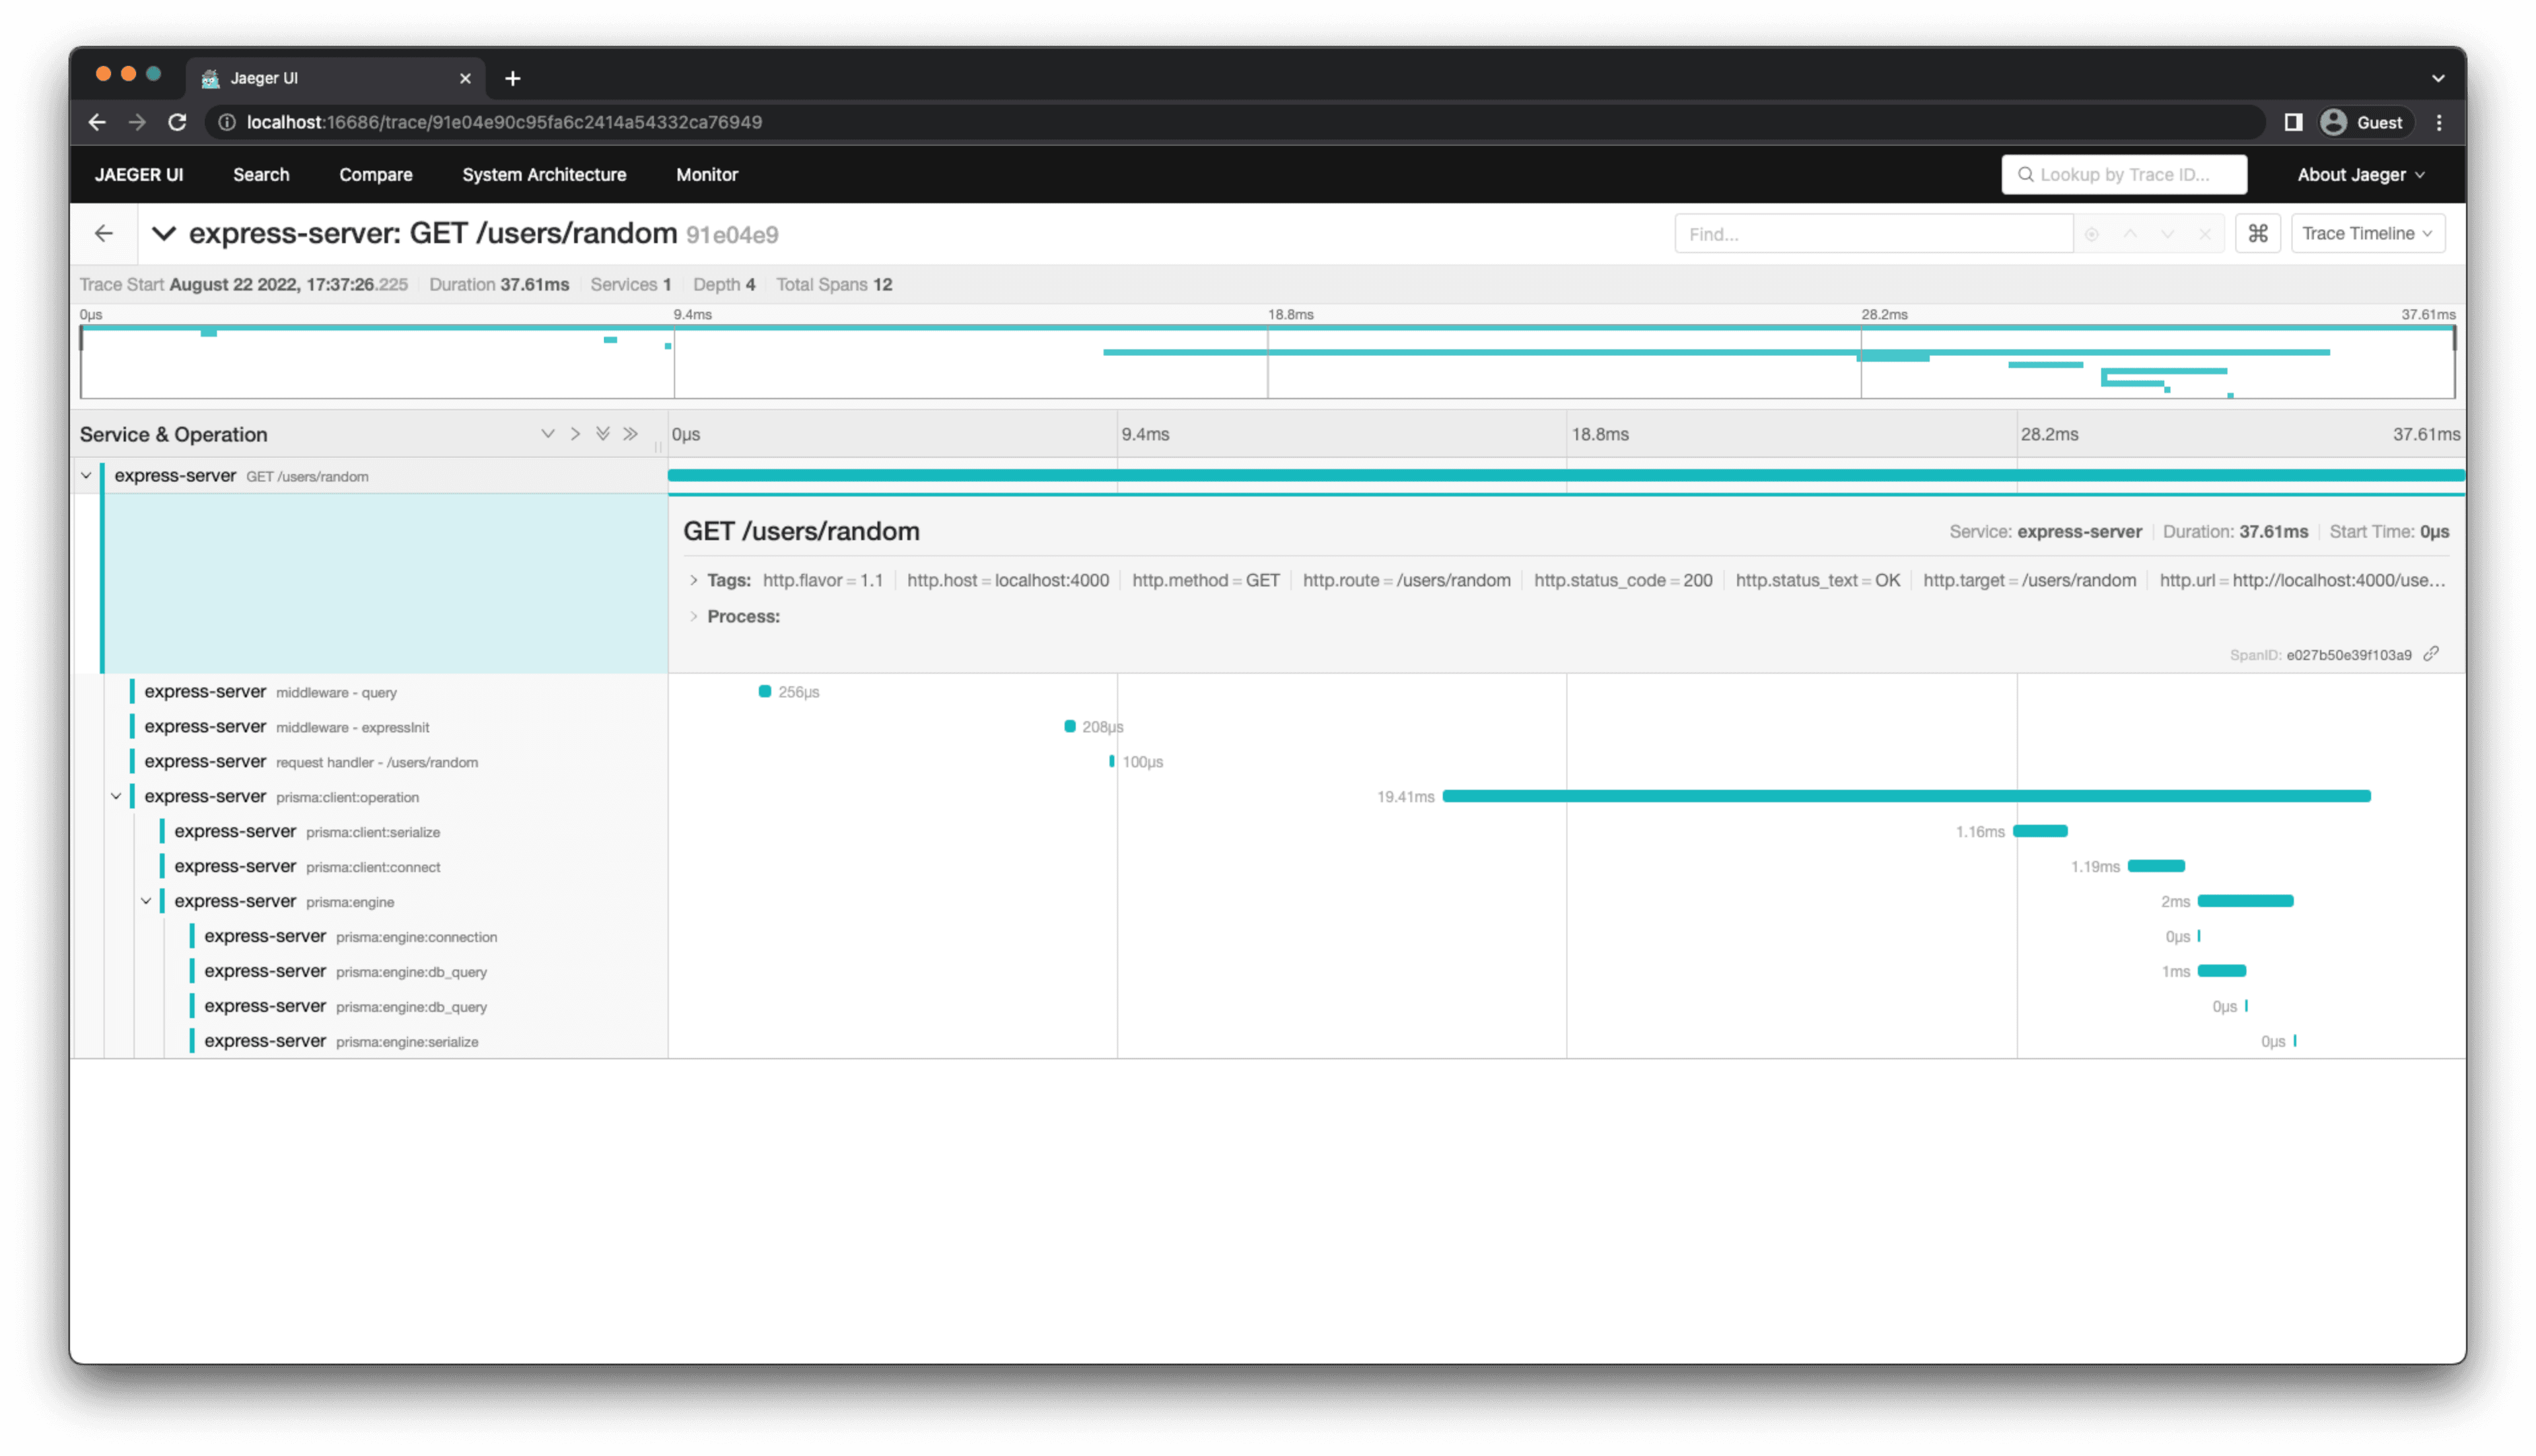
You should see much more granular spans showing the different steps as the request passes through your code. In particular, you should see new spans generated by the ExpressInstrumentation library that show the request passing through various Express middleware and the GET /users/random request handler.
Note: For a list of available instrumentation libraries, check out the OpenTelemetry Registry.
Reduce the performance impact of tracing
If your application is sending a large number of spans to a collector (like Jaeger), it can have a significant impact on the performance of your application. This is usually not a problem in your development environment but can be an issue in production. You can take a few steps to mitigate this.
Send traces in batches
Currently, you are sending traces using the SimpleSpanProcessor. This is inefficient because it sends spans on at a time. You can instead send the spans in batches using the BatchSpanProcessor.
Make the following change in your tracing.ts file to use the BatchSpanProcessor in production:
diff // tracing.ts


import { Resource } from "@opentelemetry/resources";
import { SemanticResourceAttributes } from "@opentelemetry/semantic-conventions";
+import { SimpleSpanProcessor, BatchSpanProcessor } from "@opentelemetry/sdk-trace-base";
import { NodeTracerProvider } from "@opentelemetry/sdk-trace-node";
import { trace, Tracer } from "@opentelemetry/api";
import { JaegerExporter } from "@opentelemetry/exporter-jaeger";
import { registerInstrumentations } from "@opentelemetry/instrumentation";
import { PrismaInstrumentation } from '@prisma/instrumentation';
import { ExpressInstrumentation } from '@opentelemetry/instrumentation-express'
import { HttpInstrumentation } from '@opentelemetry/instrumentation-http'

export default function initializeTracing(serviceName: string): Tracer {
    const provider = new NodeTracerProvider({
        resource: new Resource({
            [SemanticResourceAttributes.SERVICE_NAME]: serviceName,
        }),
    });

    const jaegerExporter = new JaegerExporter({
        endpoint: "http://localhost:14268/api/traces",
    });

+    if (process.env.NODE_ENV === 'production') {
+        provider.addSpanProcessor(new BatchSpanProcessor(jaegerExporter))
+    } else {
+        provider.addSpanProcessor(new SimpleSpanProcessor(jaegerExporter))
+    }

    registerInstrumentations({
        instrumentations: [
            new HttpInstrumentation(),
            new ExpressInstrumentation(),
            new PrismaInstrumentation()
        ],
        tracerProvider: provider,
    });

    provider.register();

    return trace.getTracer(serviceName);
};
Note that you are still using SimpleSpanProcessor in a development environment, where optimizing performance is not a big concern. This ensures traces show up as soon as they are generated in development.
Send fewer spans via sampling
Probability sampling is a technique that allows OpenTelemetry tracing users to lower span collection performance costs by the use of randomized sampling techniques. Using this technique, you can reduce the number of spans sent to a collector while still getting a good representation of what is happening in your application.
Update tracing.ts to use probability sampling:
diff // tracing.ts

// imports

+import { TraceIdRatioBasedSampler } from '@opentelemetry/sdk-trace-base'

export default function initializeTracing(serviceName: string): Tracer {
+    const traceRatio = process.env.NODE_ENV === 'production' ? 0.1 : 1.0;
    const provider = new NodeTracerProvider({
+        sampler: new TraceIdRatioBasedSampler(traceRatio),
        resource: new Resource({
            [SemanticResourceAttributes.SERVICE_NAME]: serviceName,
        }),
    });

    const jaegerExporter = new JaegerExporter({
        endpoint: "http://localhost:14268/api/traces",
    });

    if (process.env.NODE_ENV === 'production') {
        provider.addSpanProcessor(new BatchSpanProcessor(jaegerExporter))
    } else {
        provider.addSpanProcessor(new SimpleSpanProcessor(jaegerExporter))
    }

    registerInstrumentations({
        instrumentations: [
            new HttpInstrumentation(),
            new ExpressInstrumentation(),
            new PrismaInstrumentation()
        ],
        tracerProvider: provider,
    });

    provider.register();

    return trace.getTracer(serviceName);
};
Just like for batching, you are incorporating probability sampling only in production.
Summary and final remarks
Congratulations! 🎉
In this tutorial, you learned:
- What tracing is, and why you should use it.
- What OpenTelemetry is, and how it relates to tracing.
- How to visualize traces using Jaeger.
- How to integrate tracing into an existing web application.
- How to use automatic instrumentation libraries to improve code observability.
- How to reduce the performance impact of tracing in production.
You can find the source code for this project on GitHub. Please feel free to raise an issue in the repository or submit a PR if you notice a problem. You can also reach out to me directly on Twitter.