Database Metrics with Prisma, Prometheus & Grafana

Prisma's metrics feature gives you detailed insights into how Prisma interacts with your database. In this tutorial, you will learn how to use metrics to monitor your database using Prisma, Prometheus and Grafana.
Table Of Contents
- Introduction
- Prerequisites
- Clone the repository
- Integrate metrics into your application
- Integrate Prometheus
- Visualize metrics with Grafana
- Summary
Introduction
This tutorial will teach you about using metrics to improve your application's monitoring capabilities. You will see hands-on how to integrate metrics into a web application built using Prisma, PostgreSQL and Express.
You will use a pre-built Express API server that uses Prisma to interact with a PostgreSQL database. Throughout the tutorial, you will learn how to add metrics to the API server using Prisma's metrics feature. You will also learn how to set up and configure Prometheus and Grafana to collect and visualize the generated metrics.
What are metrics?
Metrics are numerical representations of data used to monitor and observe system behavior over time. You can use it to ensure the system performs as expected, identify potential problems, measure business goals, etc.
In Prisma, metrics is a new feature that allows you to monitor how Prisma interacts with your database. Metrics expose a set of counters, gauges, and histograms that provide information about the state of Prisma and the database connection. The metrics Prisma exposes include:
- total number of Prisma Client queries executed (
prisma_client_queries_total) - total number of SQL or MongoDB queries executed (
prisma_datasource_queries_total) - the number of active database connections (
prisma_pool_connections_open) - histogram containing the duration of all executed Prisma Client queries (
prisma_client_queries_duration_histogram_ms) - ... and much more!
Note: A complete list of the available metrics is available in the metrics docs.
Metrics can be analyzed directly by your application and can also be sent to external monitoring systems and time series databases, like Prometheus or StatsD. Integration with these external systems can significantly improve your monitoring ability by providing the following features out of the box:
- Real-time performance monitoring through visualizations and dashboards
- Query and analysis of historical data
- Precise and automated alerts for failures and performance degradations
In this tutorial you will be using Prometheus to collect and Grafana to visualize metrics.
Note: Metrics is often combined with tracing to get a granular overview of the system. To learn more about tracing, take a look at our tracing tutorial.
Technologies you will use
You will be using the following tools in this tutorial:
- Prisma as the Object-Relational Mapper (ORM)
- PostgreSQL as the database
- Prometheus as the metrics collector
- Grafana as the metrics visualization tool
- Express as the web framework
- TypeScript as the programming language
Prerequisites
Assumed knowledge
This tutorial is beginner-friendly. However, it assumes:
- Basic knowledge of JavaScript or TypeScript (preferred)
- Basic knowledge of backend web development
Note: This tutorial assumes no prior knowledge about metrics.
Development environment
To follow along with this tutorial, you will be expected to:
- ... have Node.js installed.
- ... have Docker and Docker Compose installed.
Note: If you are using Linux, please make sure your Docker version is 20.10.0 or higher. You can check your Docker version by running
docker versionin the terminal. - ... optionally have the Prisma VS Code Extension installed. The Prisma VS Code extension adds some really nice IntelliSense and syntax highlighting for Prisma.
- ... optionally have access to a Unix shell (like the terminal/shell in Linux and macOS) to run the commands provided in this series.
If you don't have a Unix shell (for example, you are on a Windows machine), you can still follow along, but the shell commands may need to be modified for your machine.
Clone the repository
You will be using an existing Express web application we built for this tutorial.
To get started, perform the following actions:
- Clone the repository:
- Navigate to the cloned directory:
- Install dependencies:
- Start the PostgreSQL database on port 5432 with Docker:
Note: If you close the terminal window running the Docker container, it will also stop the container. You can avoid this if you add a
-doption to the end of the command, like this:docker-compose up -d.
- Apply database migrations from the
prisma/migrationsdirectory:
Note: This command will also generate Prisma Client and seed the database.
- Start the server:
Note: You should keep the server running as you develop the application. The
devscript should restart the server any time there is a change in the code.
Project structure and files
The repository you cloned has the following structure:
metrics-tutorial-prisma
  ├── README.md
  ├── package-lock.json
  ├── package.json
  ├── node_modules
  ├── prisma
  │   ├── migrations
  │   │   ├── 20220927123435_init
  │   │   │   └── migration.sql
  │   │   └── migration_lock.toml
  │   ├── schema.prisma
  │   └── seed.ts
  ├── server.ts
  ├── docker-compose.yml
  ├── loadtest.js
  └── tsconfig.json
The repository contains the code for a REST API. It contains a /articles endpoint where you can run various CRUD (Create, Read, Update & Delete) operations. There is also an /articles/audit endpoint which can be queried to get logs of changes that have been made to various articles.
The notable files and directories in this repository are:
prismaschema.prisma: Defines the database schema.migrations: Contains the database migration history.seed.ts: Contains a script to seed your development database with dummy data.
server.ts: The Express REST API implementation with various endpoints.loadtest.js: A script to generate lots of traffic to the REST API using k6.
Note: Feel free to explore the files in the repository to better understand the application.
Integrate metrics into your application
Your Express application has all the core "business logic" already implemented. To measure the performance of your application, you will integrate metrics.
This section will teach you how to initialize metrics and expose them from your web server.
Enable metrics in Prisma Client
Metrics is currently available in Prisma as a Preview feature. To use it, you will need to enable the metrics feature flag in the generator block of your schema.prisma file:
// prisma/schema.prisma

generator client {
  provider        = "prisma-client-js"
+ previewFeatures = ["metrics"]
}

datasource db {
  provider = "postgresql"
  url      = env("DATABASE_URL")
}

model Article {
  id        Int      @id @default(autoincrement())
  title     String   @unique()
  body      String
  published Boolean  @default(false)
  createdAt DateTime @default(now())
  updatedAt DateTime @updatedAt
}

model Audit {
  id        String   @id @default(uuid())
  tableName Tables
  recordId  Int
  action    Actions
  createdAt DateTime @default(now())
}

enum Tables {
  Article
}

enum Actions {
  Create
  Update
  Delete
}
Now, regenerate Prisma Client:
npx prisma generateWith the metrics feature enabled, Prisma will allow you to retrieve metrics about your database operations using the prisma.$metrics API. You can expose metrics in JSON format or Prometheus format.
Expose metrics from your web server
In this section, you will expose database metrics from your Express web server. To do this, you will create a new endpoint called GET /metrics, which will return metrics in Prometheus format.
To implement the GET /metrics endpoint, add the following route to server.ts:
// server.ts
// ...
app.get("/metrics", async (_req, res: Response) => {
res.set("Content-Type", "text");
let metrics = await prisma.$metrics.prometheus();
res.status(200).end(metrics);
});
// error handler (existing code)
app.use((error, request, response, next) => {
console.error(error);
response.status(500).end(error.message);
});
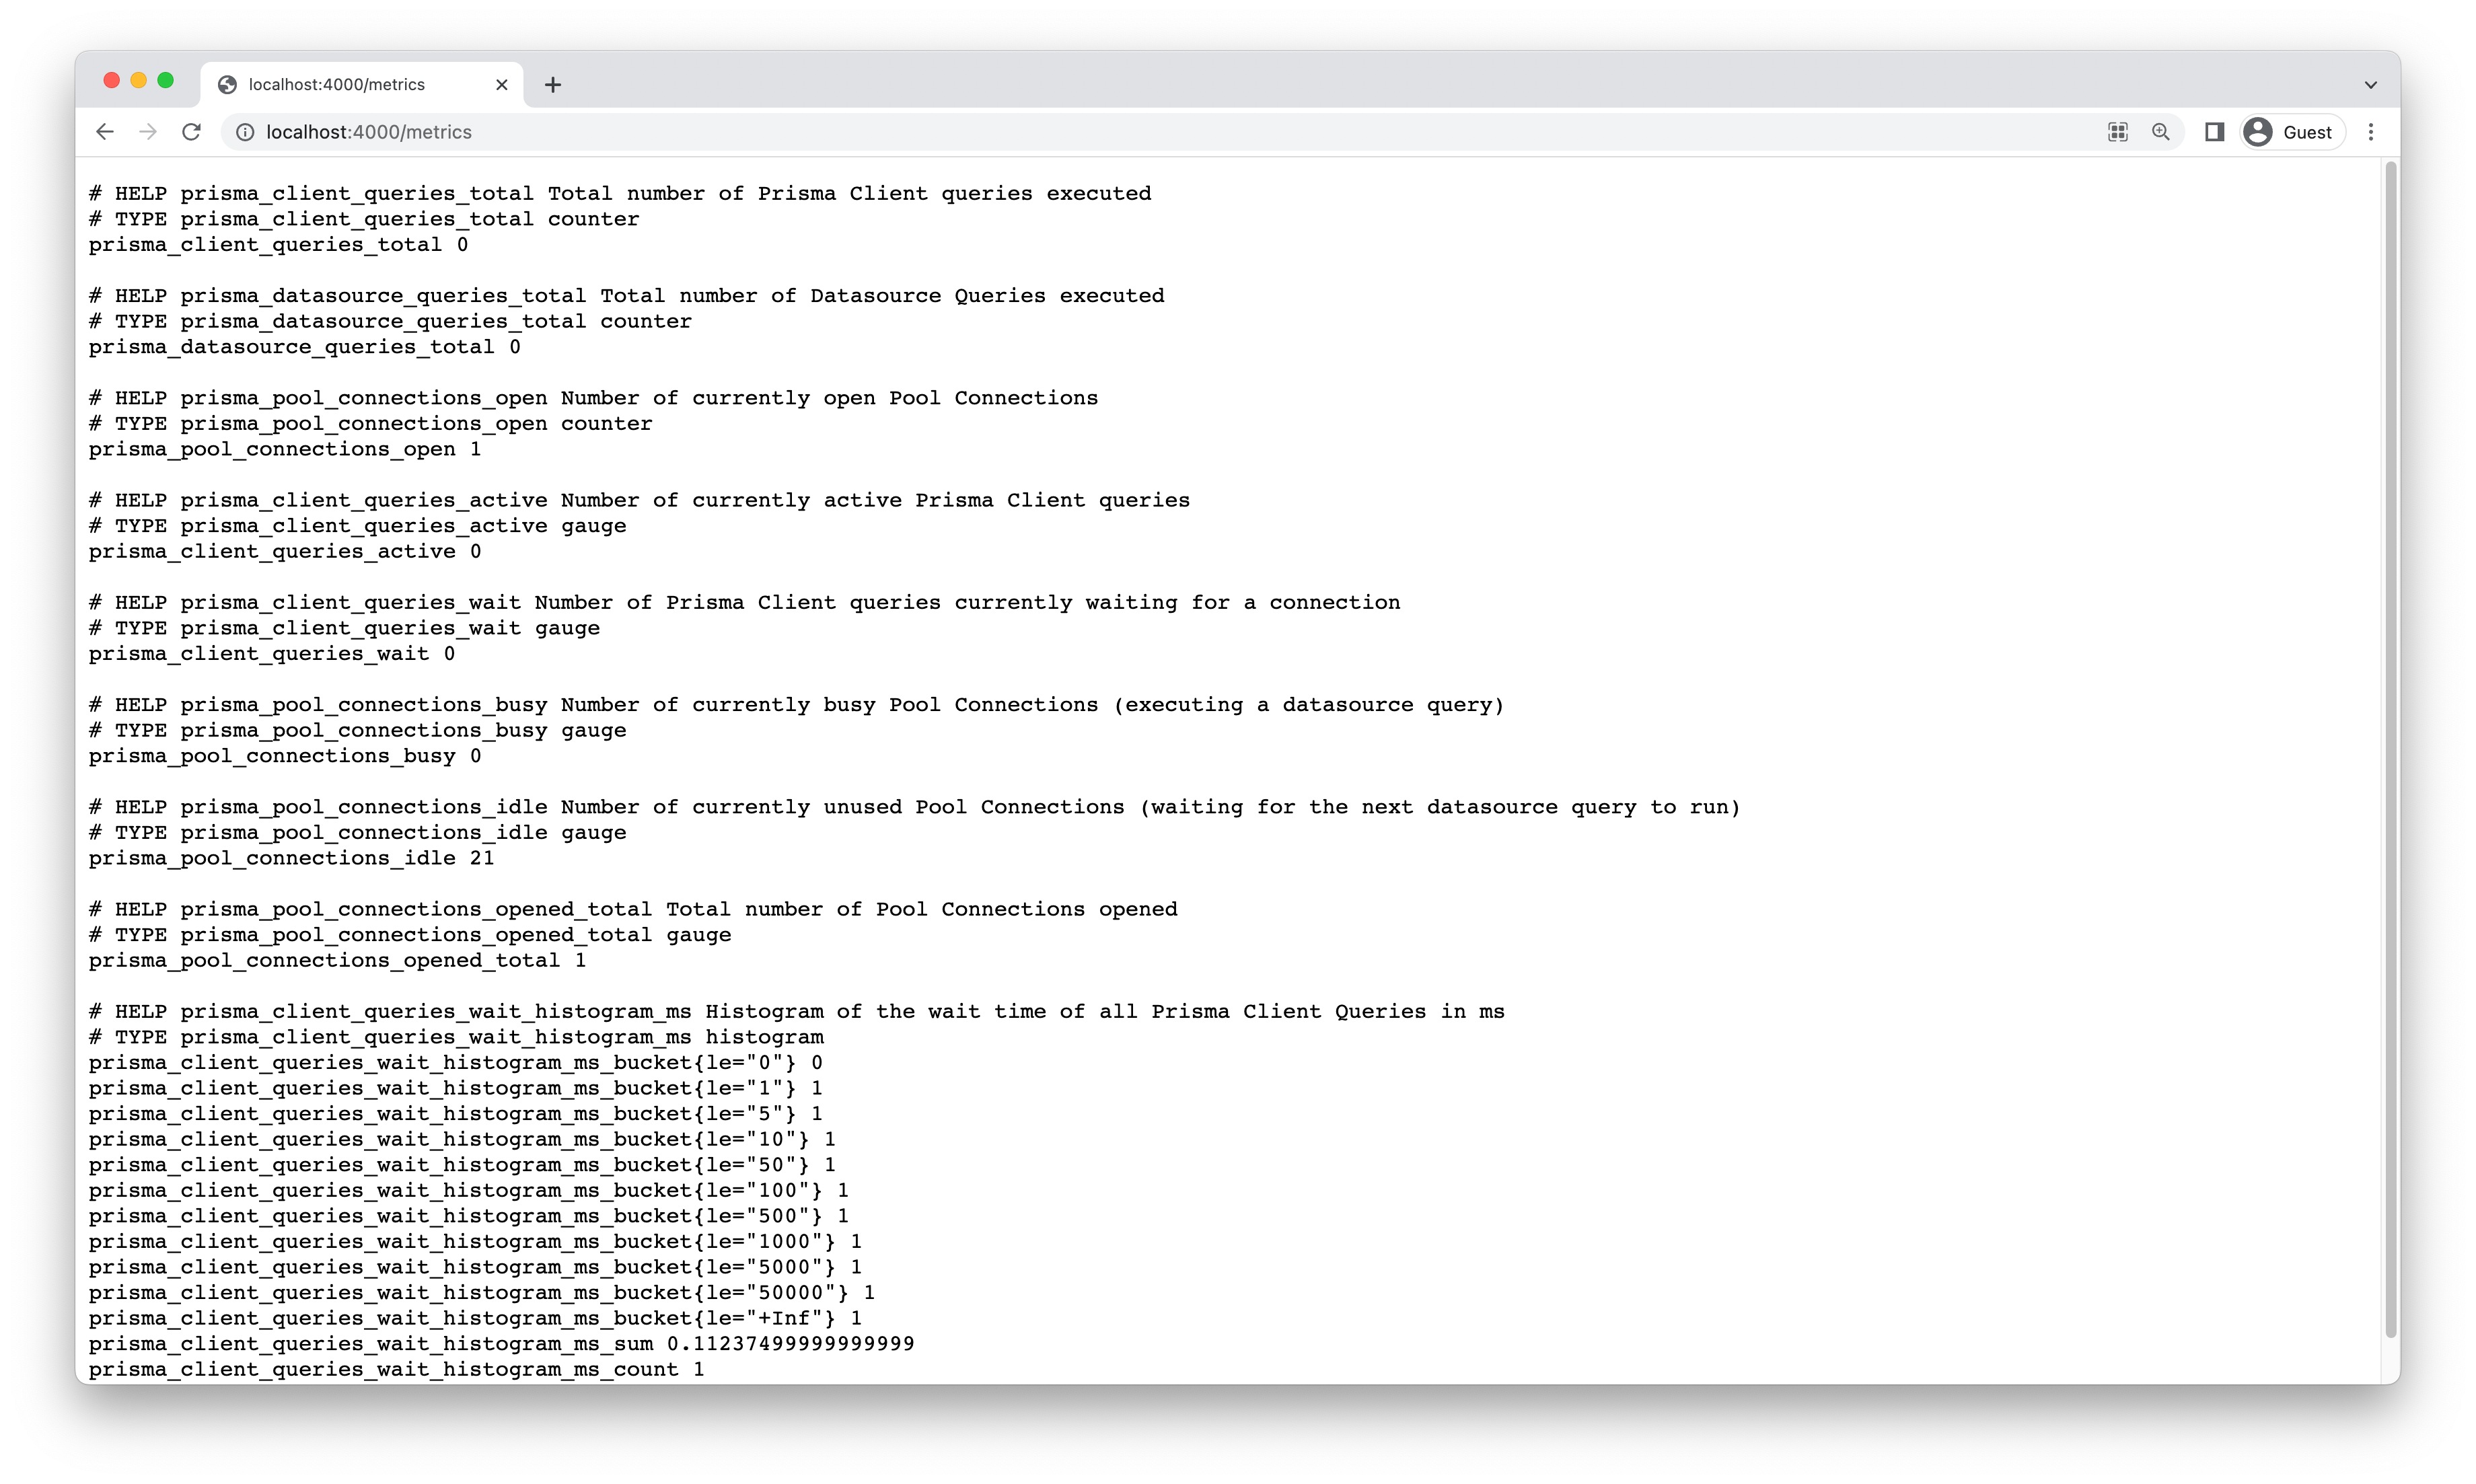
// ...Make sure the server is running and then go to http://localhost:4000/metrics to see the generated metrics.
Note: You can start the server by running
npm run dev.
Note: You can also retrieve metrics in JSON format with
prisma.$metrics.json(). You can read more about the JSON format in the docs.
Integrate Prometheus
In this section, you will learn how to configure Prometheus and integrate it into your application. Prometheus collects metrics by periodically requesting data from a particular endpoint. You will configure Prometheus to scrape metrics data from the http://localhost:4000/metrics endpoint.
Create the Prometheus configuration file
First, create a new folder called prometheus at the root of your project. Then, create a new file called prometheus.yml in this folder.
mkdir prometheus
touch prometheus/prometheus.yml
Update the file with the configuration for Prometheus:
# prometheus/prometheus.yml

scrape_configs:
  - job_name: 'prometheus'
    scrape_interval: 1s

    static_configs:
      - targets: ['host.docker.internal:4000']
        labels:
          service: 'prisma-metrics'
          group: 'production'
Some of the important options to keep in mind are:
job_nameis metadata used to identify metrics from a specific configuration.scrape_intervalis the interval at which Prometheus will scrape the metrics endpoint.targetscontain a list of endpoints to scrape. Prometheus, by default, will scrape the/metricsendpoint. So it does not have to be explicitly mentioned.Note:
host.docker.internalis a special DNS name that resolves to the internal IP address of the host machine running Docker. As Prometheus is running inside Docker, this special DNS name is used so that it can resolvehttp://localhostof the host machine (your computer).
Start a Prometheus instance
Now that the configuration file is ready, you need to run Prometheus. You will set up Prometheus inside a Docker container by extending your docker-compose.yml file. Add the prometheus image to the docker-compose.yml file by replacing the current file contents with the following:
# docker-compose.yml

version: '3.8'
services:
  postgres:
    image: postgres:13.5
    environment:
      - POSTGRES_USER=myuser
      - POSTGRES_PASSWORD=mypassword
    volumes:
      - postgres:/var/lib/postgresql/data
    ports:
      - '5432:5432'
  prometheus:
    image: prom/prometheus
    volumes:
      - ./prometheus/prometheus.yml:/etc/prometheus/prometheus.yml
      - prometheus-storage:/prometheus
    command:
      - '--config.file=/etc/prometheus/prometheus.yml'
      - '--storage.tsdb.path=/prometheus'
    ports:
      - 9090:9090
    extra_hosts:
      - "host.docker.internal:host-gateway"
volumes:
  postgres:
  prometheus-storage:
The new prometheus image is set up to use the prometheus/prometheus.yml configuration file you created earlier. It will also expose port 9090 to the host machine, which you can use to access the Prometheus user interface (UI). The image will use a volume called prometheus-storage to store data for Prometheus.
Note: The
extra_hostsoption is needed to resolvehost.docker.internalon Linux machines. If you are on Linux, make sure you're using Docker version 20.10.0 or higher. You can check this Github comment for more information.
Now you need to restart the containers you are running in Docker Compose. You can do this by running the docker-compose up command again and adding the --force-recreate option. Open up a new terminal window and run the following command:
docker-compose up --force-recreateIf the command is successful, you should be able to see the Prometheus UI in http://localhost:9090.
Explore metrics in the Prometheus UI
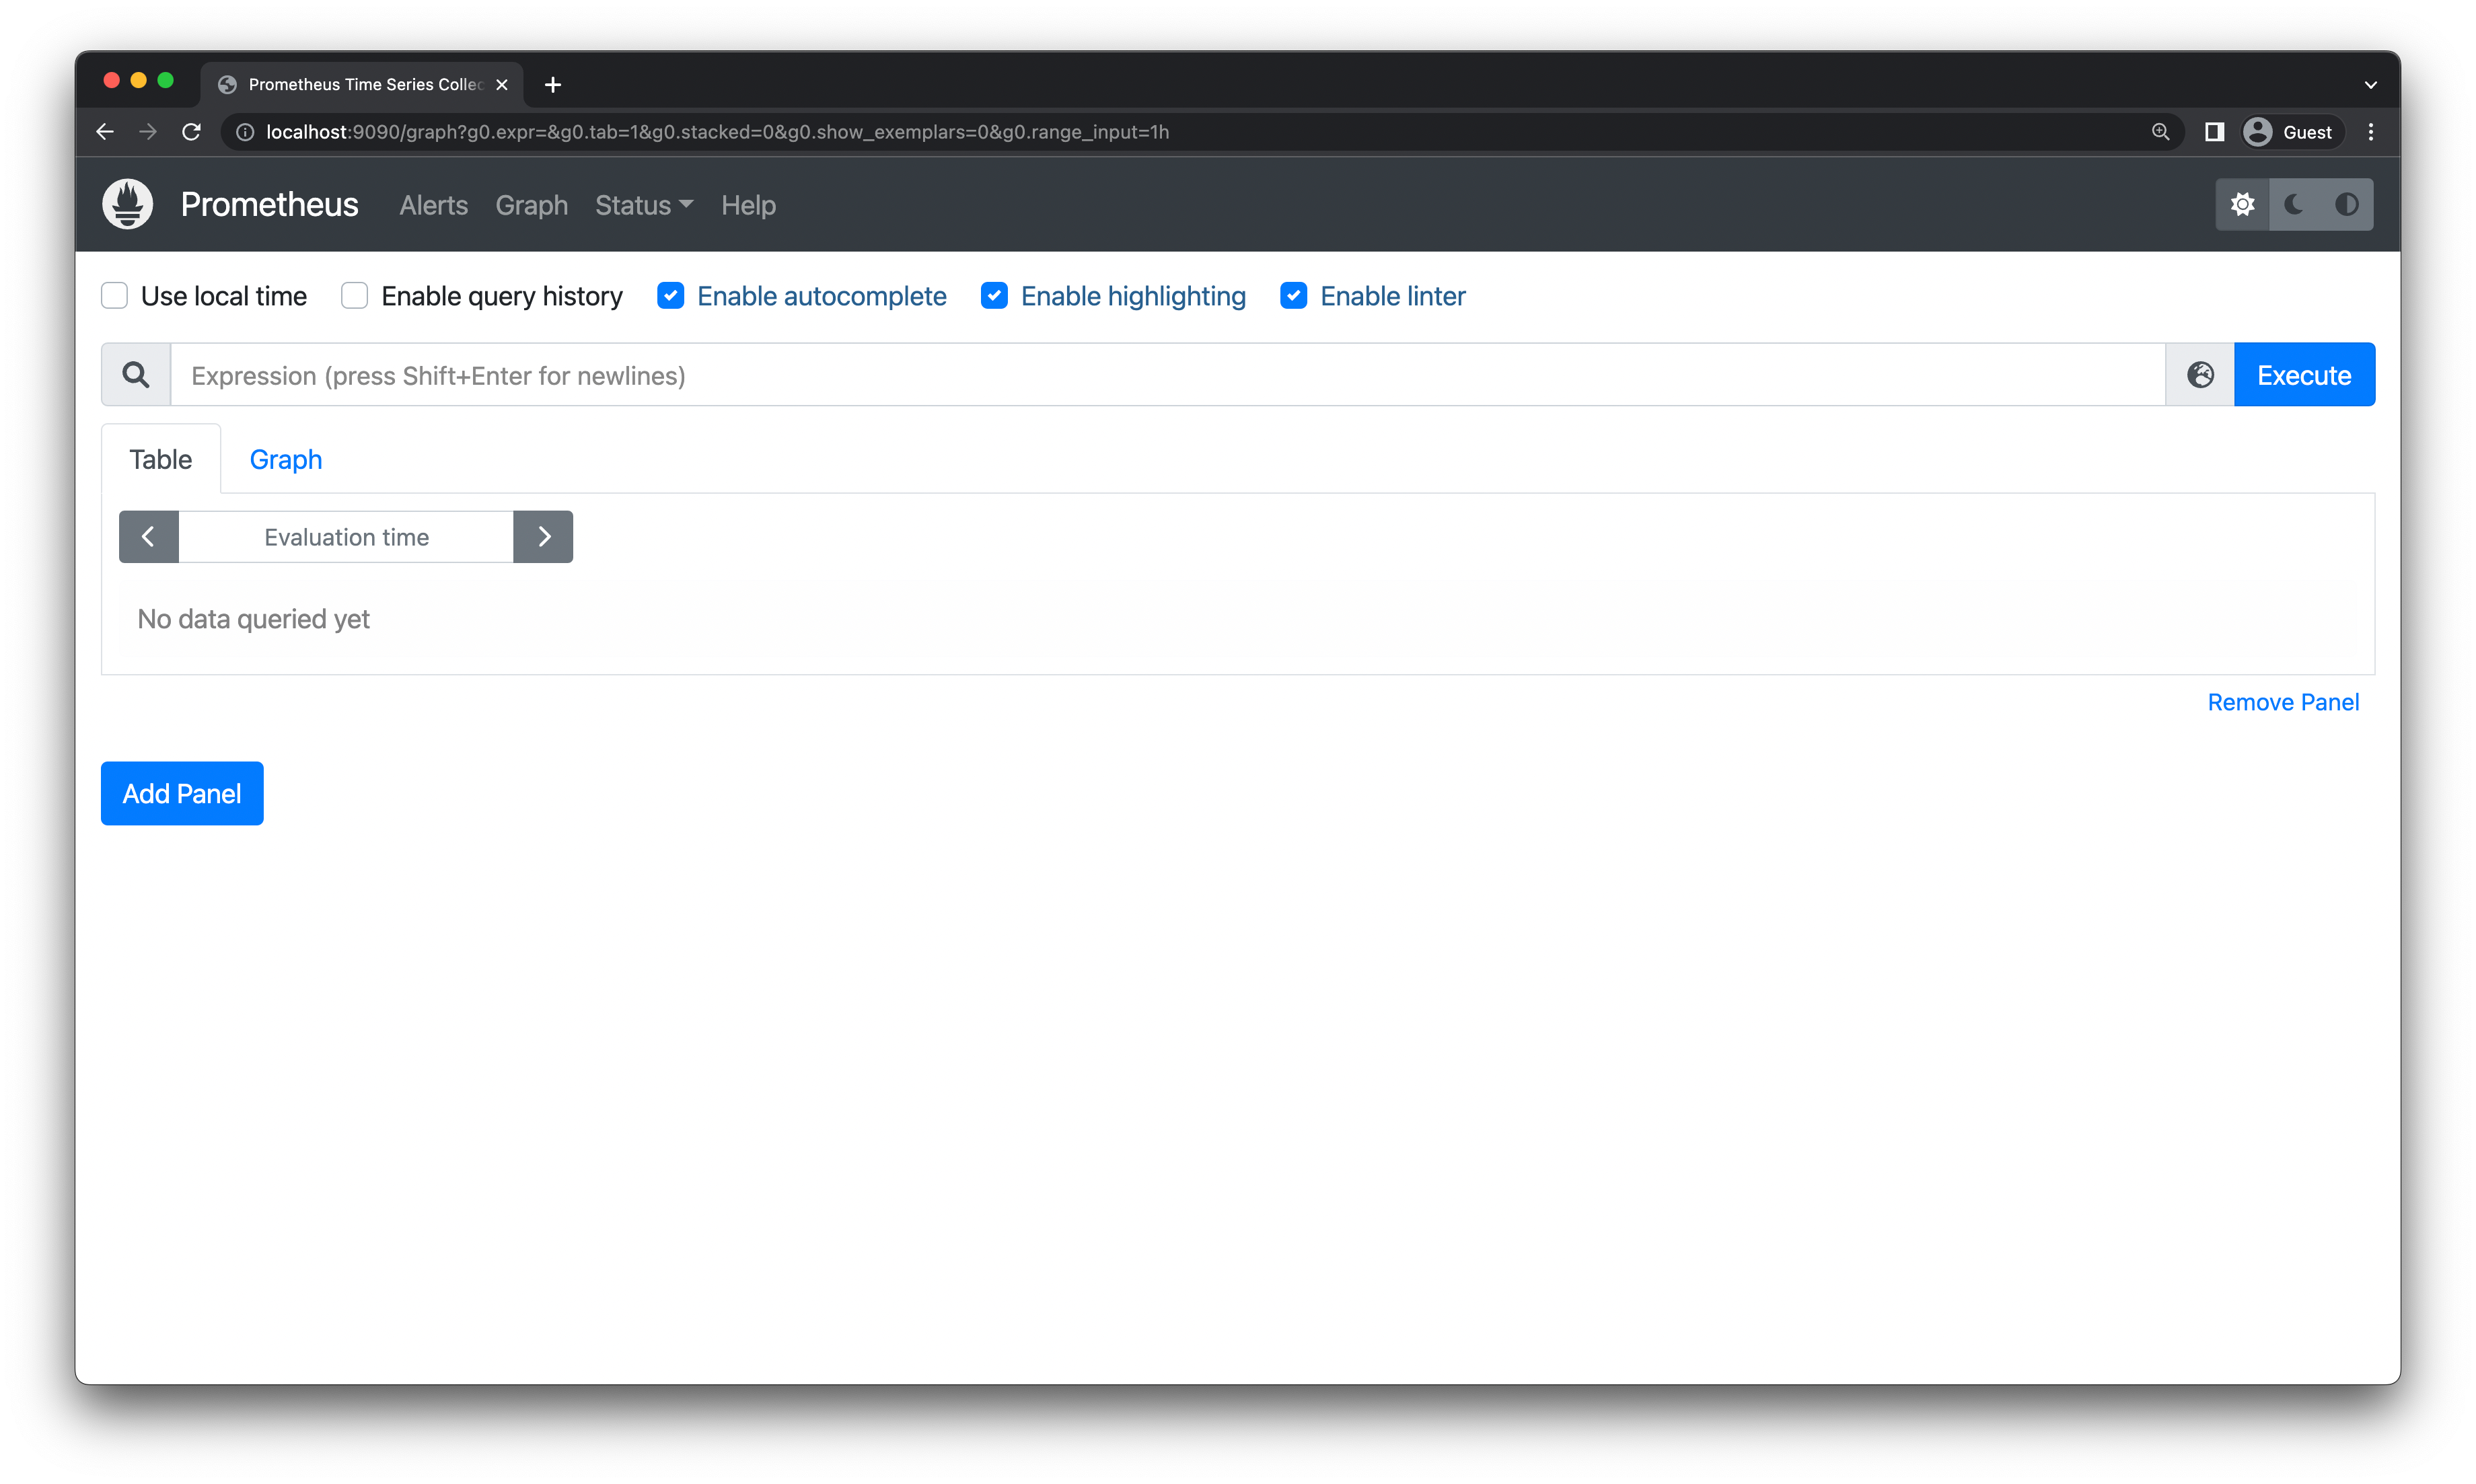
In the Expression input field, you can enter a PromQL (Prometheus Query Language) query to retrieve metrics data. For example, you can enter prisma_client_queries_total to see the number of queries executed by Prisma Client. After entering the query, click the Execute button to see the results.
Note: You might see the response Empty query result instead of an actual value. This is also fine — proceed to the next step.
The interface you are seeing is called the expression browser. It allows you to see the result of any PromQL expression in a table or graph format.
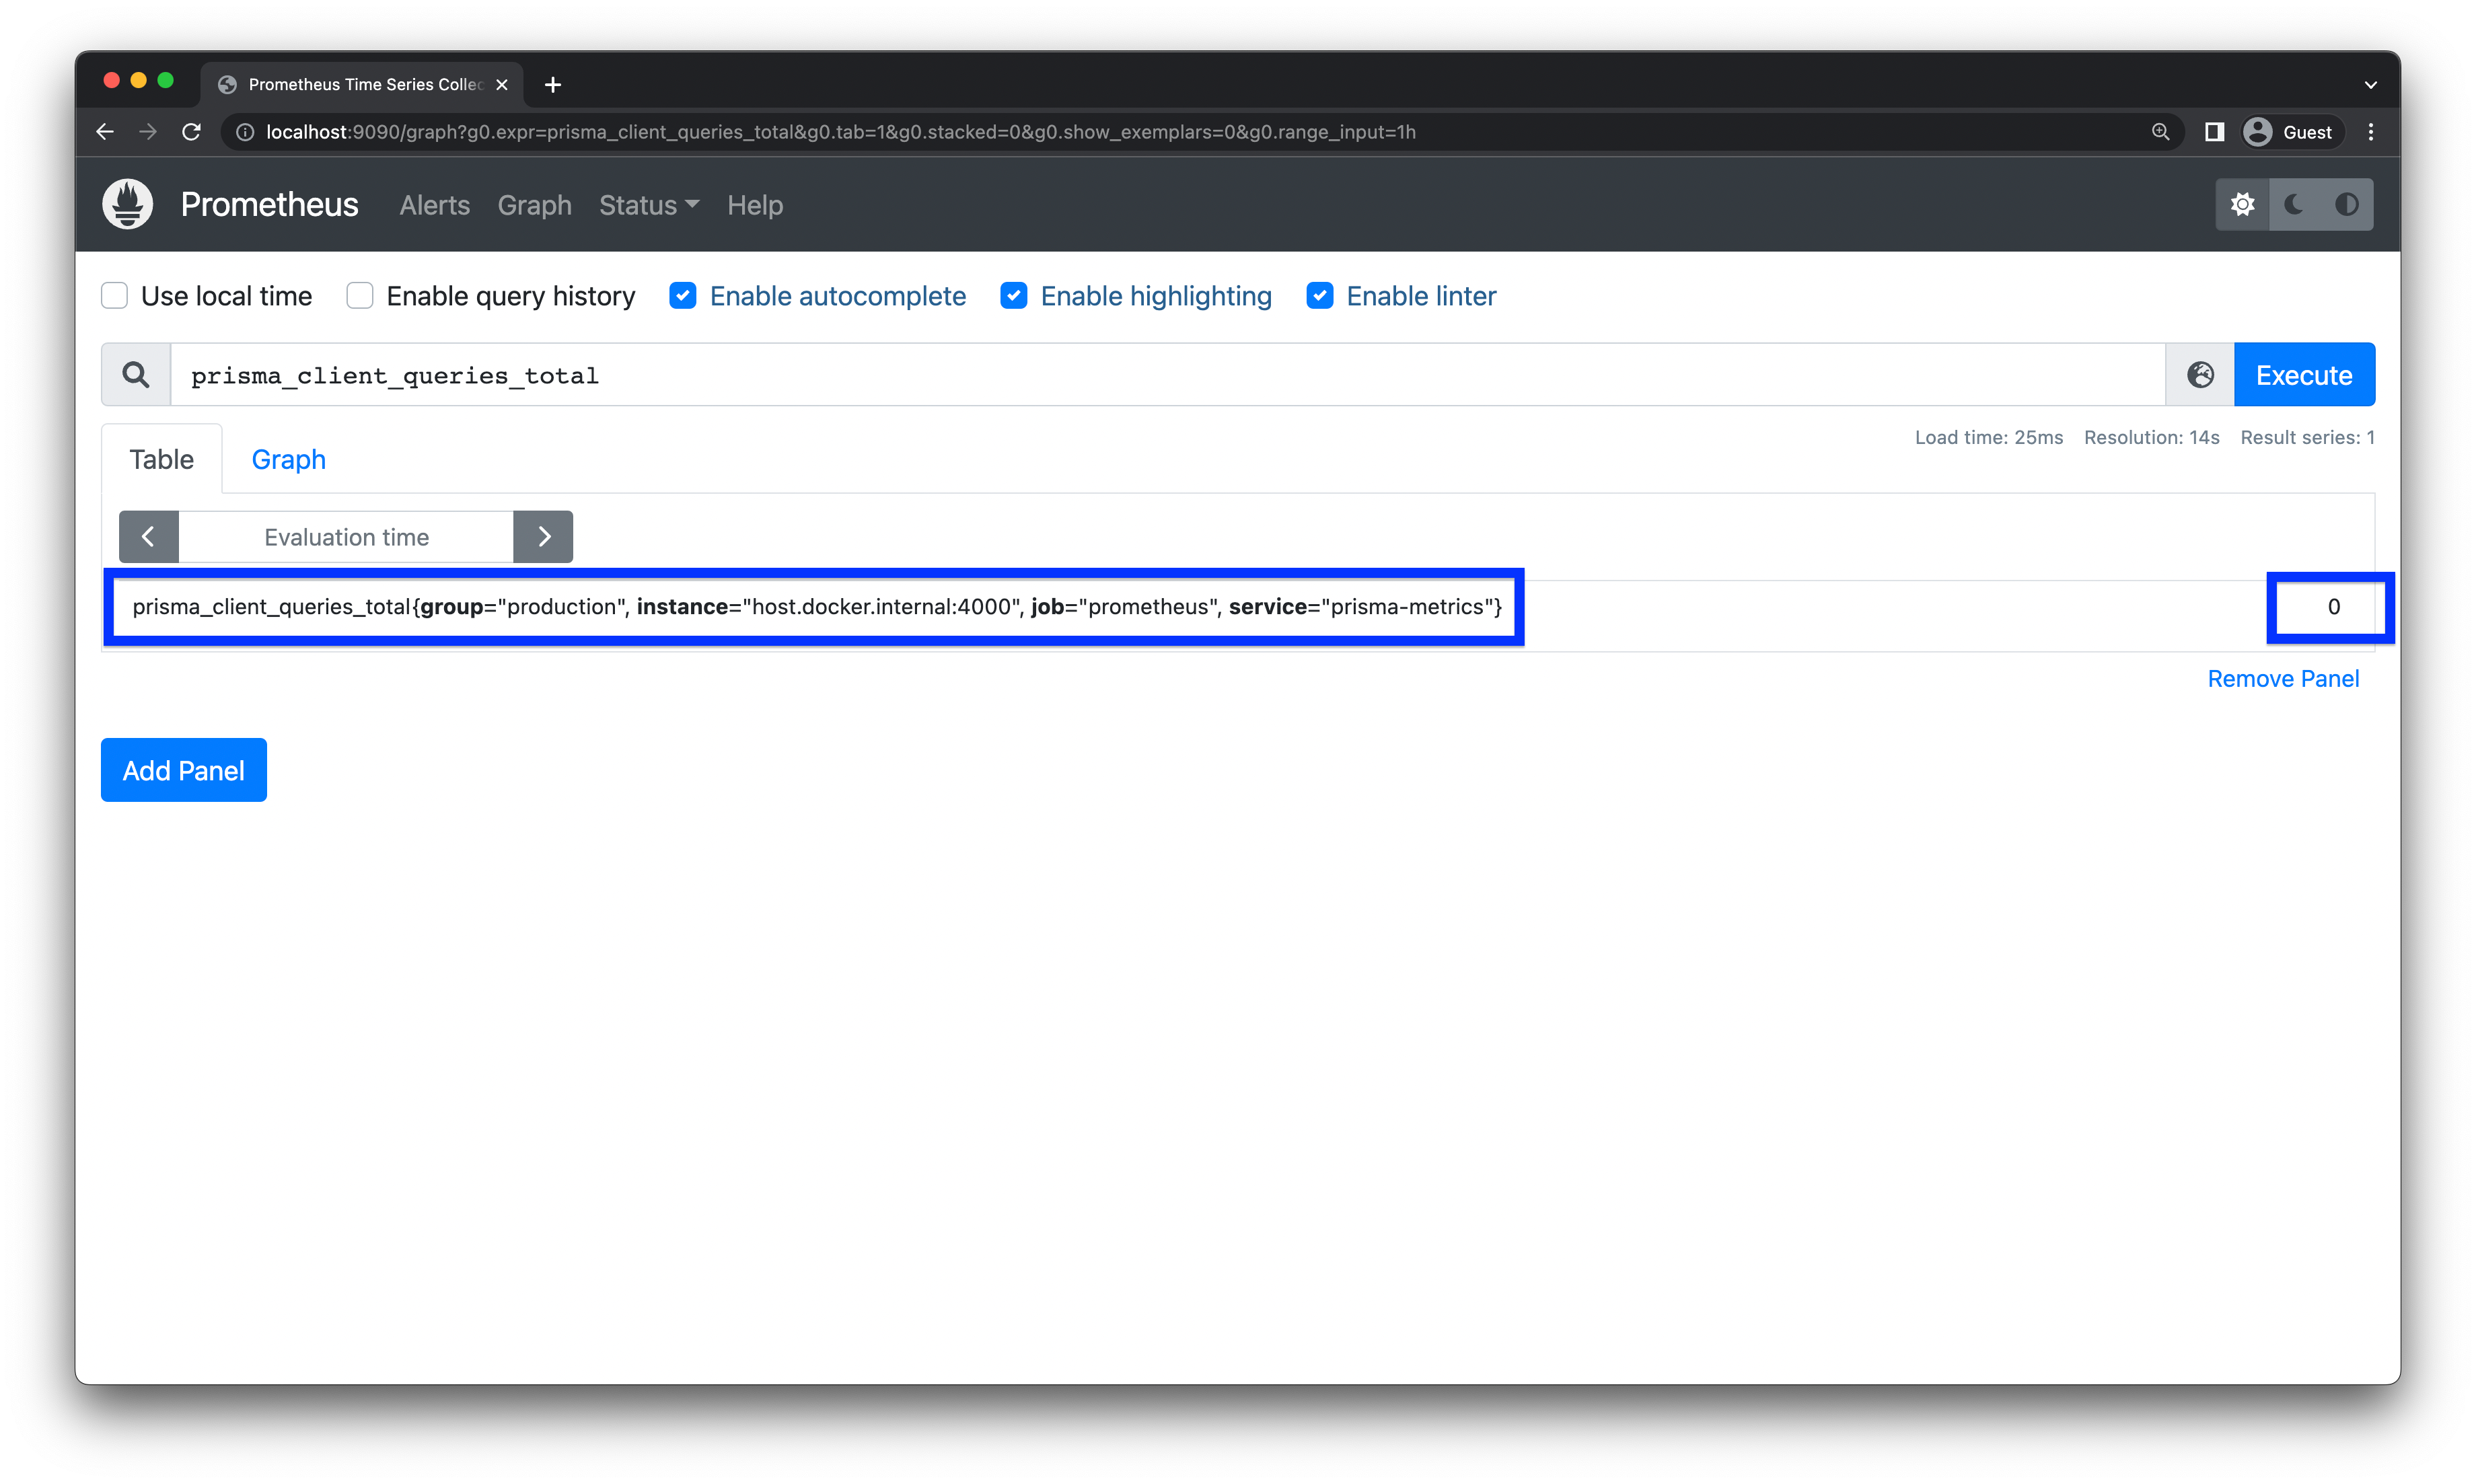
Currently, the number of queries is 0 or empty because you have not yet made any API requests. Instead of manually making lots of requests to generate metrics data, you will use the load testing tool k6. A load testing script called loadtest.js is already provided in the project. You can run this script by executing the following command:
npm run loadtestThis command will first pull the k6 Docker image and then start making many requests to your Express API. After k6 has begun making requests, you can go back to the Prometheus UI and execute the previous query again. You should now see the number of queries increase rapidly.
The Prometheus UI also provides a way to see metrics in a time series graph. You can do this by clicking on the Graph tab. In the Expression input field, enter the same query as before and click the Execute button. You should see a graph showing the number of Prisma Client queries executed over time.
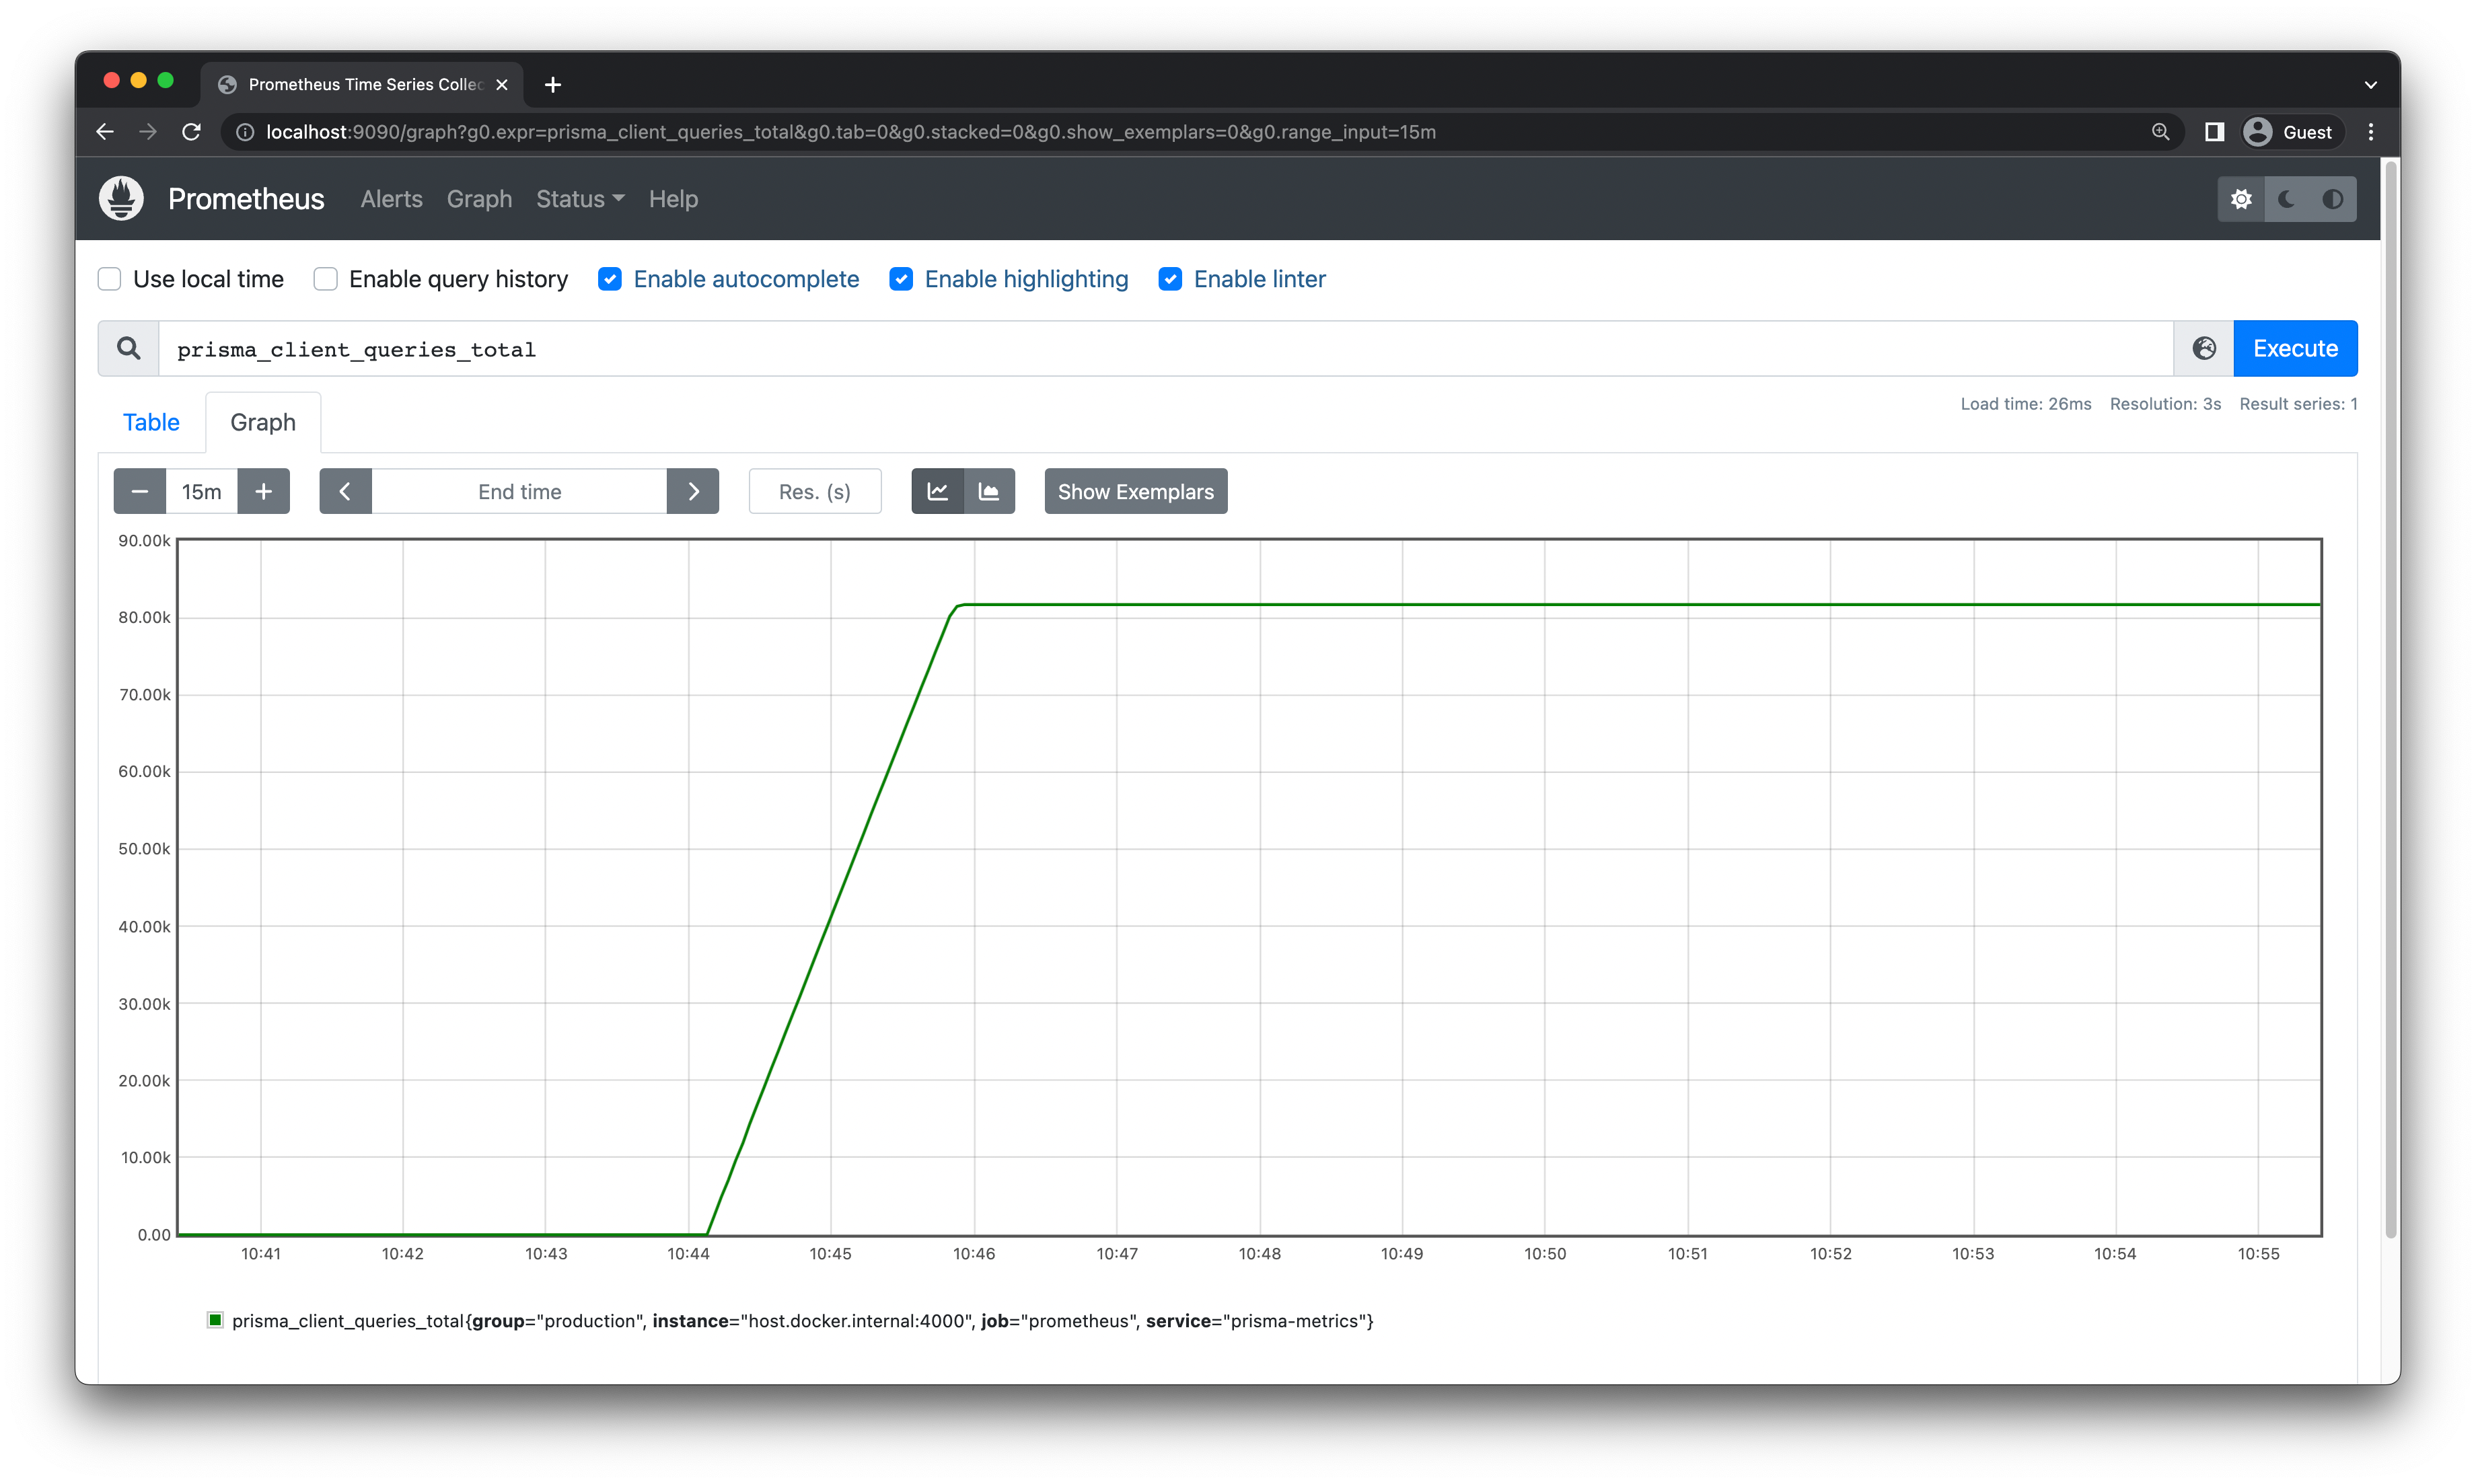
Note: Feel free to try out other queries in the Prometheus UI. You can find a list of all the available metrics in the Prisma docs. You can also learn how to do more complex PromQL queries by reading the Prometheus documentation.
The Prometheus expression browser is a helpful tool for quickly visualizing ad-hoc queries. But it is not a fully featured visualization tool. Prometheus is often paired with Grafana, which is a feature rich and robust visualization and analytics tool.
Visualize metrics with Grafana
In this section, you will learn how to set up Grafana and use it to create dashboards that visualize metrics data. Grafana is a popular open-source visualization tool that is widely used for monitoring and visualization.
You will first integrate Grafana so that it can collect your application's monitoring data from Prometheus. Then you will create a dashboard that meaningfully represents various metrics exposed by your system.
Once fully configured, your application will look like this:
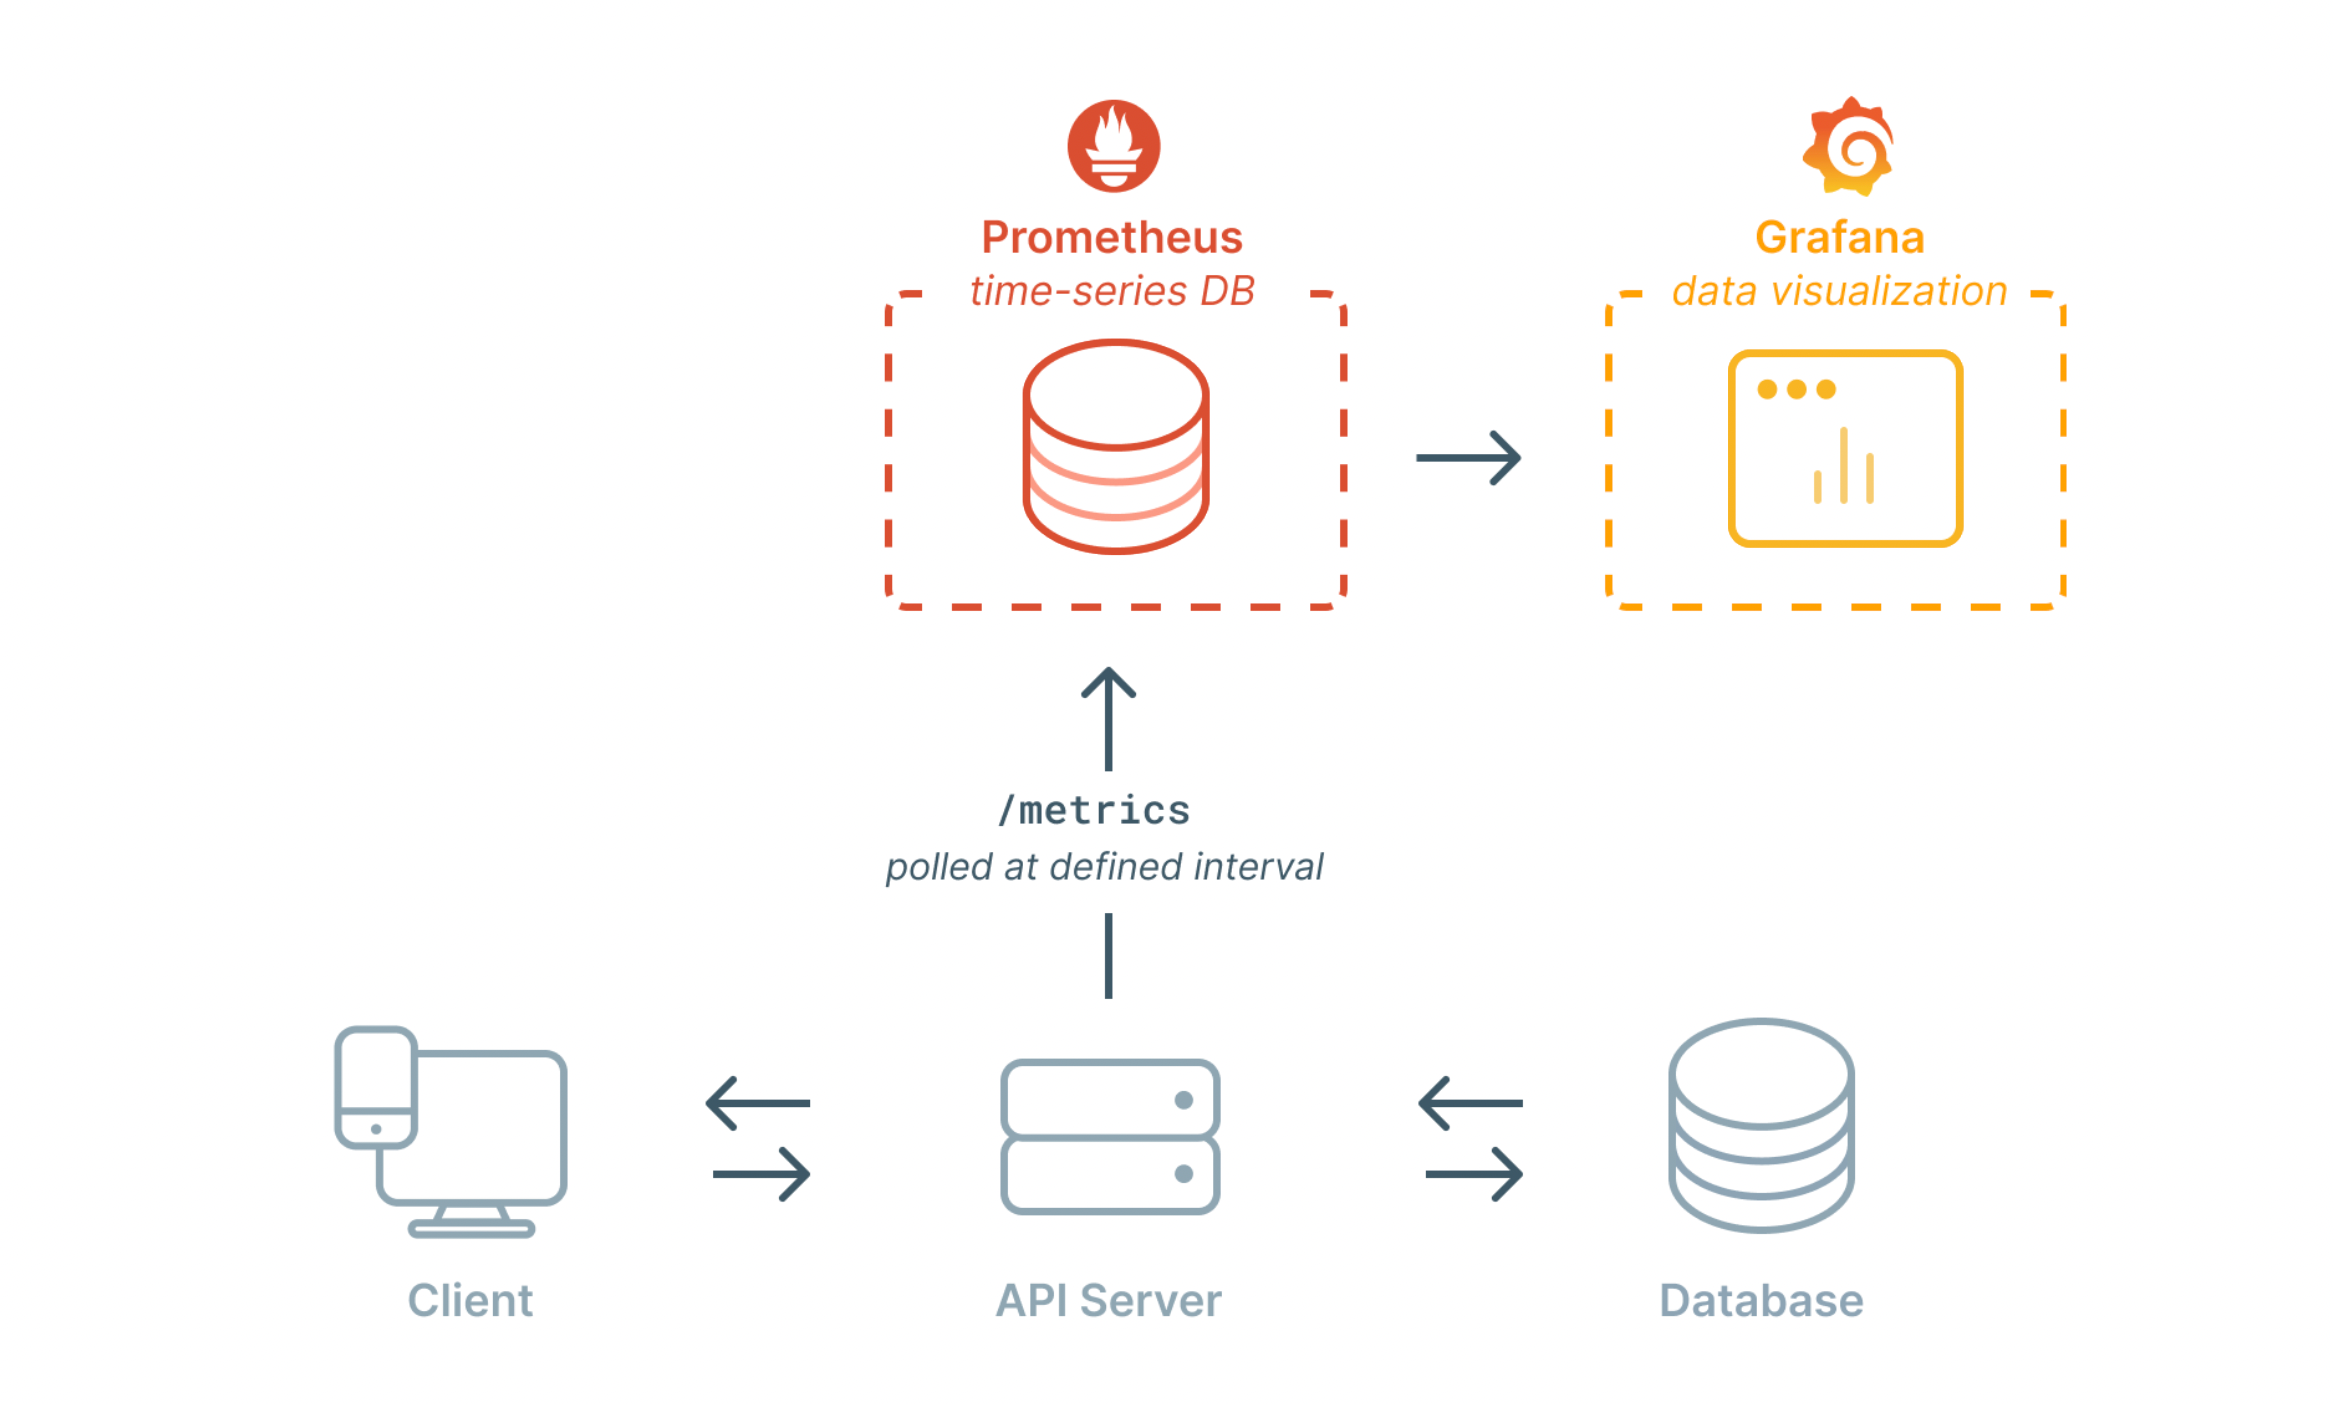
Note: Web applications usually have a frontend (client) that consume the API of the web server. However, this tutorial does not include a frontend to avoid unnecessary complexity.
Start a Grafana instance
To start a Grafana instance, you need to add a new grafana image to your Docker Compose file. Replace the current contents of docker-compose.yml with the following configuration:
# docker-compose.yml

version: '3.8'
services:
  postgres:
    image: postgres:13.5
    environment:
      - POSTGRES_USER=myuser
      - POSTGRES_PASSWORD=mypassword
    volumes:
      - postgres:/var/lib/postgresql/data
    ports:
      - '5432:5432'
  prometheus:
    image: prom/prometheus
    volumes:
      - ./prometheus/prometheus.yml:/etc/prometheus/prometheus.yml
      - prometheus-storage:/prometheus
    command:
      - '--config.file=/etc/prometheus/prometheus.yml'
      - '--storage.tsdb.path=/prometheus'
    ports:
      - 9090:9090
    extra_hosts:
      - "host.docker.internal:host-gateway"
  grafana:
    image: grafana/grafana
    volumes:
      - grafana-storage:/var/lib/grafana
    ports:
      - 3000:3000
volumes:
  postgres:
  prometheus-storage:
  grafana-storage:
The grafana image is configured to use a volume called grafana-storage to store data. This volume will be used to persist Grafana's data across restarts. The grafana image is also configured to expose port 3000 to the host machine, which you can use to access the Grafana UI.
Restart the containers again by running the following command:
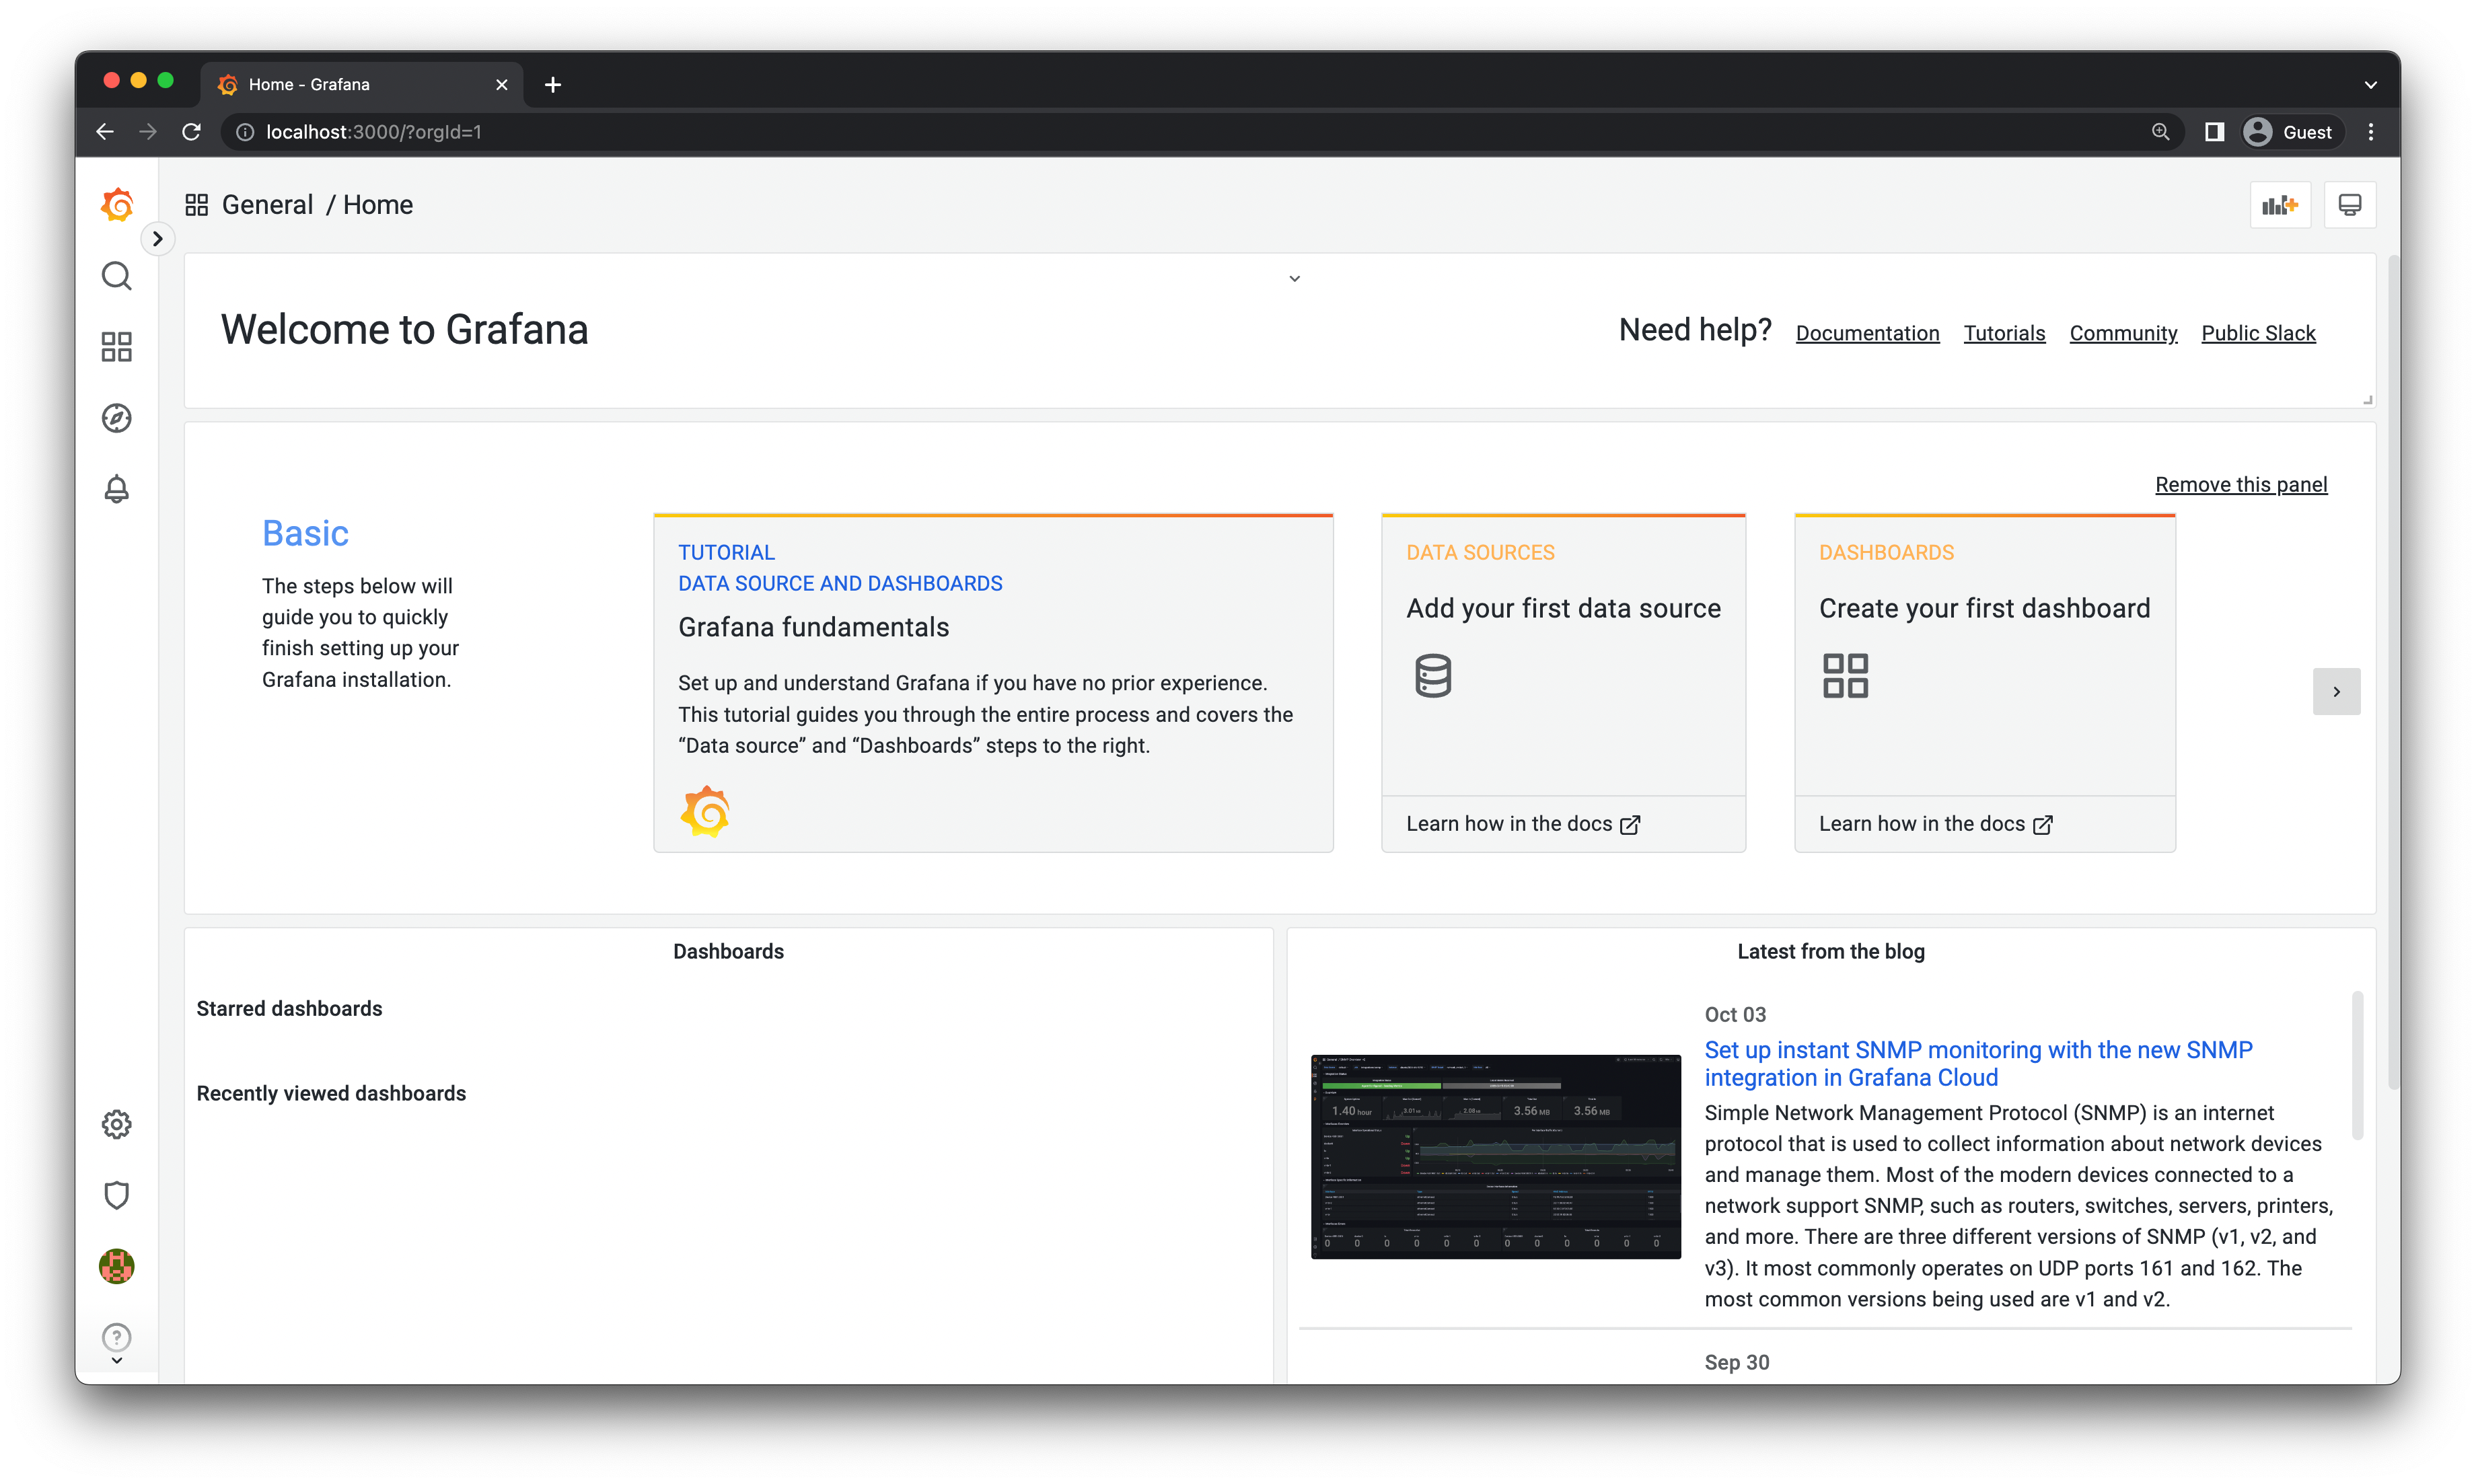
docker-compose up --force-recreateIf you go to http://localhost:3000 you will be greeted with the Grafana login screen. The default username and password are both admin, which you can use to login. You can skip creating a new password.
You should now see the Grafana landing page.
Add a Prometheus data source to Grafana
You need to add a data source to Grafana. A data source is an external system that Grafana can query to retrieve metrics data. In this case, your data source will be Prometheus.
To add a data source through the UI, do the following:
- Click on the cog icon to the bottom left in the side menu.
- In the Data sources configuration window, click on Add data source.
- Click on Prometheus as the data source type.
- In the Prometheus data source configuration page set the URL to
http://prometheus:9090and Scrape Interval to1s.http://prometheus:9090will resolve to port9090on theprometheuscontainer. This is possible because of the Docker networking that is automatically configured by Docker Compose. - Click on Save & test to save the configuration.
If everything is configured correctly, you should see a Data source is working message.
Create your first Grafana dashboard
A dashboard is a collection of visualizations that represent metrics data. Dashboards consist of one or more panels, which is the basic visualization building block in Grafana.
Note: Before you begin, you should generate some traffic by running
npm run loadtestso there's some data to visualize.
To create your first dashboard, do the following:
- Click the + New dashboard option under the Dashboards icon in the side menu.
- On the dashboard, click Add a new panel to go to the Panel Editor. The Data source in the Query tab should already be set to Prometheus.
- Inside the Query tab, fill the Metric input with
prisma_client_queries_total. - Press the + Query button, and in the new Metric, add
prisma_datasource_queries_total. - In the right sidebar, change the Title field from Panel Title to "Prisma Client Queries vs. Datasource Queries".
- Press Save at the top, and you will be asked to name the dashboard.
- Change the Dashboard name to "Prisma Metrics Dashboard" and press Save.
prisma_client_queries_total represents the total number of Prisma Client queries executed. prisma_datasource_queries_total represents the total number of database queries executed at the datasource level. The two metrics are visualized in the same graph, which allows you to compare the two.
Congratulations! You just created a dashboard that visualizes the number of queries made by Prisma Client and the Prisma Datasource. Your dashboard should now be accessible inside Grafana.
Note: You should explore the different features Grafana has to offer. For example, you can add more panels to your dashboard, change the visualization type, add annotations, etc. You can also use Grafana to set up automated alerts for monitoring your system. More information is available in the Grafana documentation.
(Optional) Import an existing Grafana dashboard
In the last section, you created a dashboard with a single panel. In this section, you will import an existing dashboard that contains multiple panels. To import a dashboard perform the following:
- Click the + Import option under the Dashboards icon in the side menu.
- Copy paste this JSON file into the Import via panel json input field.
- Click the Load button and then click Import.
You should now see a dashboard with multiple panels. You should explore the different panels and see the metrics they visualize.
Summary
In this tutorial, you learned:
- What metrics is, and why you should use it.
- How to integrate database metrics into an existing web application with Prisma.
- How to use Prometheus to collect and query metrics data.
- How to use Grafana to visualize metrics data.
For further reading, you can check out the following resources:
- Prisma metrics documentation
- Tutorial on tracing with Prisma
- Prometheus Documentation
- Grafana Documentation
We would love to get your thoughts on the metrics feature! Please give us feedback about metrics on this Github issue.
You can find the source code for this project on GitHub. Please feel free to raise an issue in the repository or submit a PR if you notice a problem. You can also reach out to me directly on Twitter.
Keep reading

Prisma Next Is ~90% As Fast as Raw PG
Prisma Next performance benchmarks achieves ~90% of the raw pg driver's peak throughput, holds latency low under load, and ships as a 148.5 KB gzipped bundle for serverless and edge workloads.


Prisma Next: A Call for Extension Authors
Prisma Next has a tiny core that knows nothing about specific databases. Postgres, vector search, and JSON-with-schema are extensions, on the same surface that's open to you. An invitation to build.


Build your next app with Prisma
Start free. Scale when you’re ready.