
Which TypeScript app hosts show what is driving my bill?
Choose a host that lets you connect billed usage to apps, resource meters and the dates when consumption changed. Prisma Compute shows requests, provisioned memory, active CPU and outbound bandwidth in Prisma Console, with daily and per-app breakdowns. Railway, Vercel and Netlify also provide usage views; compare the reporting detail as well as unit prices.
Choose on two axes: how understandable the pricing model is, and how much usage detail you can inspect today. A small list of clear meters makes an estimate easier to audit. A usage dashboard helps you establish which project or resource actually consumed them. Neither alone explains every change in the invoice.
Prisma Compute is a useful fit when you want the TypeScript app next to Prisma Postgres, explicit Compute meters and no separate deployment or preview-creation charge. Prisma Postgres works with any PostgreSQL client; Prisma ORM is optional. We make Prisma Compute and Prisma Postgres. The provider reporting details linked here were checked on October 16, 2026.
What should a useful cost breakdown show?
Look for a path from the invoice to a resource and then to the behavior that changed. At minimum, ask for the billing period, included usage, additional usage and unit rates. Project or service breakdowns help narrow the investigation; application traces and logs help identify the route or job behind it.
| Question | Evidence to look for | Why it helps |
|---|---|---|
| Which project changed? | Project or service usage for the same billing period. | Avoid attributing a team-wide increase to the wrong app. |
| Which resource grew? | Requests, CPU, memory, transfer, storage and other billed meters. | Distinguish traffic growth from a resource-heavy code change. |
| When did it change? | Daily trends compared with deployments and scheduled jobs. | Connect the increase to an event you can investigate. |
| What is actually charged? | Included allowances, credits, fixed fees and usage above them. | A consumption chart may not equal the payable invoice. |
An observability dashboard is useful evidence, but a latency chart is not automatically a billing report. Check whether a view shows raw resource consumption, projected cost, charged usage or a mixture of them.
Which hosts provide which visibility?
The hosts below are listed alphabetically. A reporting feature does not establish that one host costs less for your workload.
| App host | Documented visibility | What to account for |
|---|---|---|
| Netlify | Credit usage by meter and daily credit charts on credit-based plans. | Convert credits using your plan's rates. Credit-based and legacy plans have different billing models. |
| Prisma Compute + Prisma Postgres | The Console Usage page shows four Compute meters by day and app, plus request response statuses. Database usage is available in the Console, CLI and API. | Equivalent Compute CLI/API usage reporting is still being built. Resource consumption is not a complete allocation of invoice costs to routes or customers. |
| Railway | Project usage and cost estimates, with service-level breakdowns and a usage CLI. | Separate measured usage from estimates and include the workspace plan and other invoice items. |
| Vercel | A Usage view with project filters, resource usage, projected costs and regional breakdowns. | Check plan credits, regional rates and the difference between usage reporting and additional observability features. |
Choose Railway if service-level usage investigation and its CLI fit your team's workflow. Choose Vercel if its project and regional views fit the way you deploy. Choose Netlify if your team is comfortable tracing the credit model back to function usage and other meters.
Choose Prisma Compute when you want daily and per-app resource visibility alongside the TypeScript app and database. Its separate CPU and memory meters help distinguish active computation from an app that stays running while it waits for a database, model or other API.
How do I explain a growing Prisma Compute bill?
1. Open the Console Usage page
Open your workspace in Prisma Console and select Usage. The Compute usage view shows requests, provisioned memory, active CPU and outbound bandwidth, with daily trends and totals by app. For requests, response-status breakdowns can help distinguish successful traffic from errors. Start with the app and date range that changed.
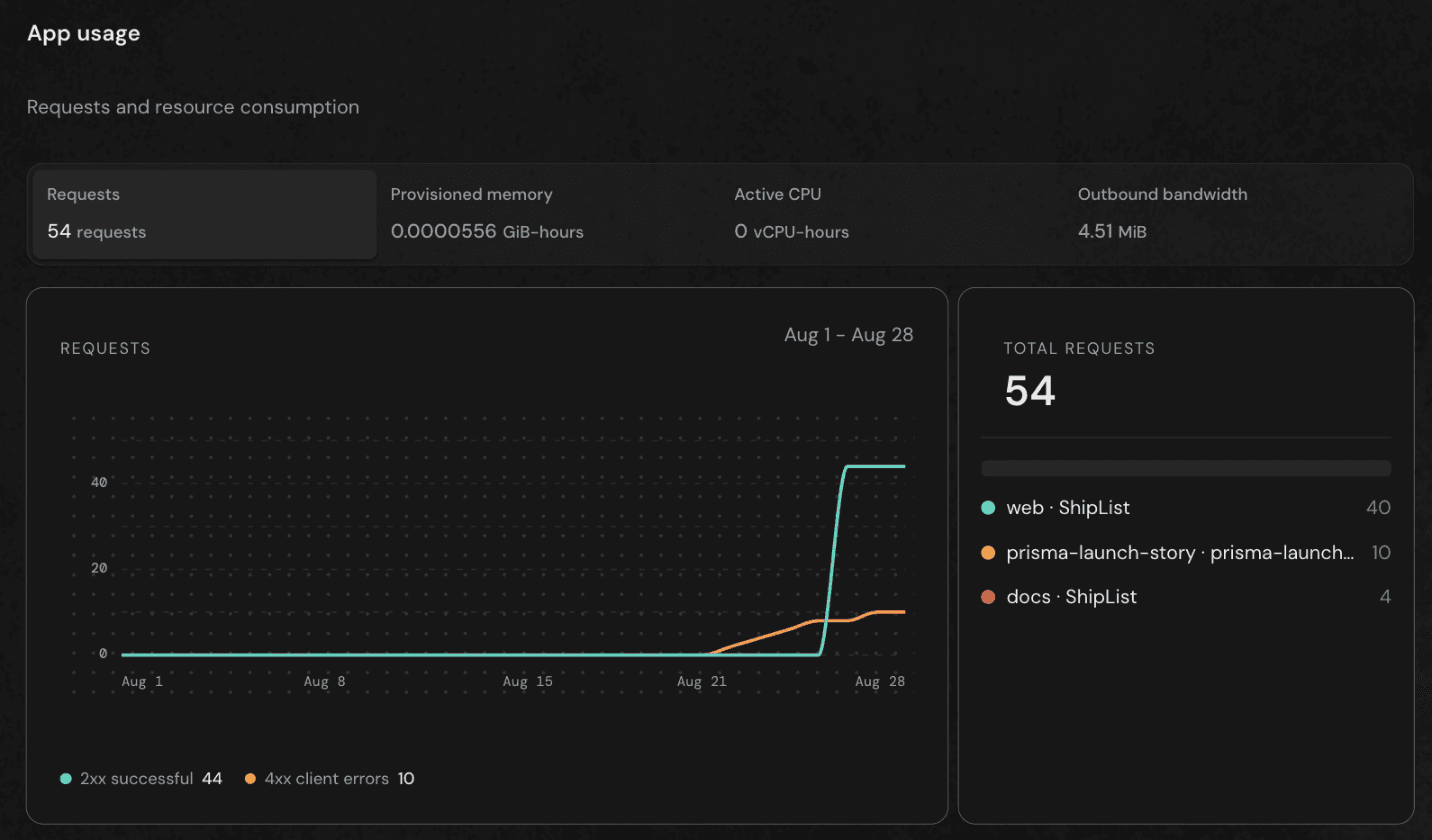
2. Separate the plan from the resources
Start with the current plan, included requests and database allowances. Then inspect usage that falls outside those allowances. Paid Compute plans meter provisioned memory, active CPU and outbound bandwidth separately from the included request allowance. Include database usage and external services in the full application budget.
The Compute pricing guide defines these four meters:
| Meter | Work it measures | A change worth investigating |
|---|---|---|
| Requests | Inbound requests the app handles. | More visitors, retries, polling or automated traffic. |
| Provisioned memory | Allocated memory while the app is running or kept awake. | Longer tasks, a larger memory allocation or fewer idle periods. |
| Active CPU | CPU time the app actually consumes. | More computation, serialization or processing per request. |
| Outbound bandwidth | Data the app sends to the public internet. | Larger responses, downloads or more streamed output. |
These are investigation prompts, not diagnoses. Verify the cause with workload measurements rather than assuming every increase is a bug.
3. Compare equivalent periods and workloads
Compare periods with similar lengths, and note changes in traffic and release timing. A bill can rise because the business grew, because one action got more expensive, or because background work changed. Track both the total and a useful business denominator, such as completed orders or successful report runs.
For example, unchanged request counts with larger outbound responses suggest checking payload sizes. A long-running task that mostly waits can keep using allocated memory even when active CPU stays low. The pricing guide's workload examples show how these resources contribute independently.
4. Investigate the database separately
Prisma Postgres exposes database usage through the Console, CLI and API. Its operations and storage are different meters from Compute CPU or outbound bandwidth. Query Insights helps investigate expensive or frequently repeated SQL, while the usage view helps establish consumption.
If one application action starts issuing more queries, compare both its performance and database operations. The query-monitoring guide explains how to test a focused query or index change.
5. Add a response policy
Once you know the main cost driver, decide what to do about it: reduce a payload, bound a retry loop, right-size resources or budget for growth. Add spending controls and alerts so the next increase reaches someone who can respond.
Keep the trade-off visible. Lowering a resource allocation may cause failures; pausing at a budget threshold can interrupt customers. Optimize the workload and the business outcome together.
When is another host a better fit?
If a complete Compute usage export through the CLI or API is required today, Prisma's current docs say that equivalent reporting is still being built. Pick a host whose existing reporting matches that requirement rather than treating published rates as an export feature.
If you need per-route or per-customer cost attribution, verify the available breakdown and instrument the application for that purpose. A host's resource report does not necessarily allocate an invoice to individual customers, and a business action can span several services.
If your team already investigates costs effectively in Vercel, Railway or Netlify, moving hosts solely for a different chart may not help. Prisma Postgres can remain the database while the app stays on another host, and Prisma Compute remains an option when hosting the TypeScript app next to its data fits the workload.
Frequently asked questions
See the work behind your bill
Inspect your app's requests, memory, CPU and bandwidth in Prisma Console, then compare consumption with your plan's allowances and rates.