Prisma Support for Tracing and Metrics Is Now in Preview

We are excited to launch two new featracing-launch-announcement-pmk4rlpc0lltures in Preview: Tracing and Metrics. These two features will allow you to monitor and troubleshoot various performance issues effectively. Try them out and share your feedback!
Developers want to be able to answer the question, "Why is my application slow?" Modern software systems are distributed and complex, making it increasingly difficult to diagnose issues that impact customer experience.
We designed the new tracing and metrics features with these concerns in mind. These features make Prisma more observable as well as easier to monitor and debug.
Get detailed insights into every Prisma operation with tracing
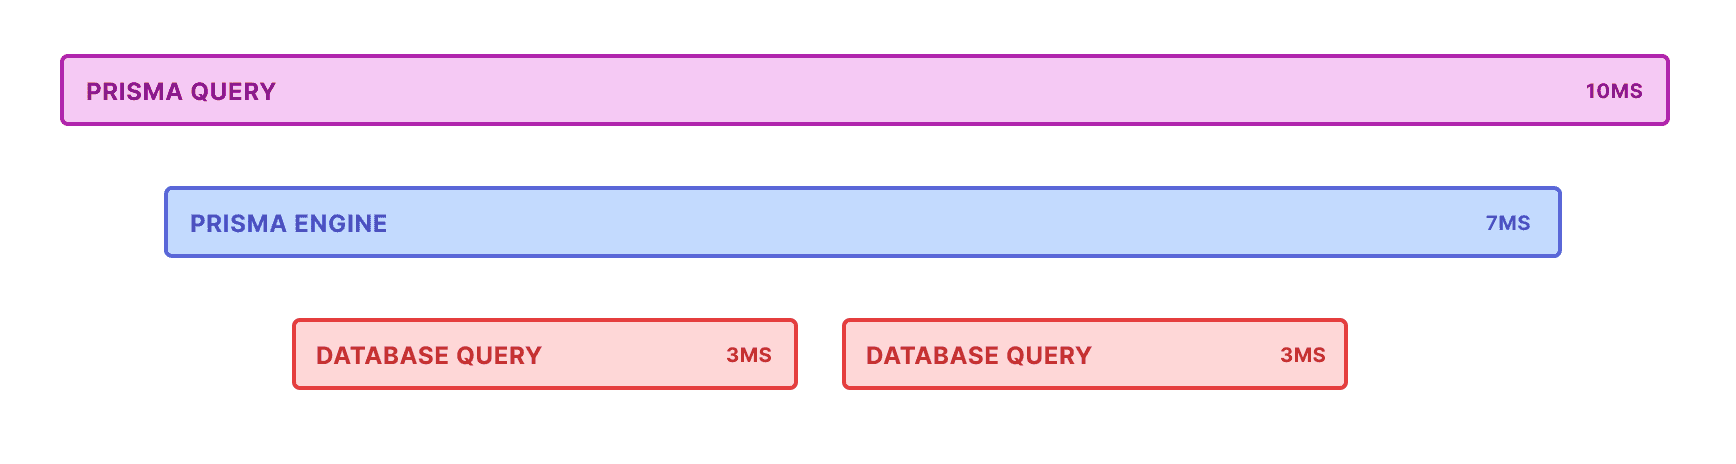
The tracing feature in Prisma provides a detailed view of every query the Prisma Client carries out, including the time taken to execute each query. This is useful for debugging performance issues, identifying bottlenecks and understanding the behavior of your database operations.
Visualize traces as waterfall diagrams
Using a tracing tool such as Jaeger or Honeycomb, traces can be visualized as waterfall diagrams like this:
Prisma tracing is OpenTelemetry compliant
Tracing is a powerful tool that can help you track requests as they flow through your application. This is especially useful for debugging distributed systems, where each request can span multiple services. To levarage the full power of tracing, it should be implemented end-to-end throughout your application.
The tracing feature in Prisma is fully compliant with OpenTelemetry, so you can integrate it seamlessly into your end-to-end application tracing setup. This also means that you can export your trace data to any OpenTelemetry-compatible tracing system, such as Jaeger, Zipkin, Honeycomb, Datadog, etc.

To get started with tracing, check out the tracing docs.
Monitor the health and performance of your system with metrics
Metrics is a new feature that allows you to monitor how Prisma interacts with your database. Metrics expose a set of counters, gauges, and histograms that provide information about the state of Prisma and the database connection. The metrics we expose include:
- total number of Prisma Client queries executed (
prisma_client_queries_total) - total number of SQL or MongoDB queries executed (
prisma_datasource_queries_total) - the number of active database connections (
prisma_pool_connections_open) - histogram containing the duration of all executed Prisma Client queries (
prisma_client_queries_duration_histogram_ms_bucket) - ... and much more!
Note: A full list of the exposed metrics is available in the metrics docs.
Prisma can often feel like a black box that magically interacts with the database on your behalf. This lack of transparency into Prisma's inner workings can be a problem when things go wrong. With metrics, we aim to give you better visibility into what Prisma is doing under the hood, so that you can diagnose and troubleshoot issues much more easily.
Metrics can be integrated with external monitoring systems
Metrics can be analyzed directly by your application and can also be sent to external monitoring systems and time series databases, like Prometheus or StatsD. Integration with these external systems can significantly improve your monitoring ability by providing the following features out of the box:
- Real-time performance monitoring through visualizations and dashboards
- Query and analysis of historical data
- Precise and automated alerts for failures and performance degradations
For example, you can create detailed dashboards and graphs by integrating Grafana, a popular visualization tool, into your metrics pipeline:
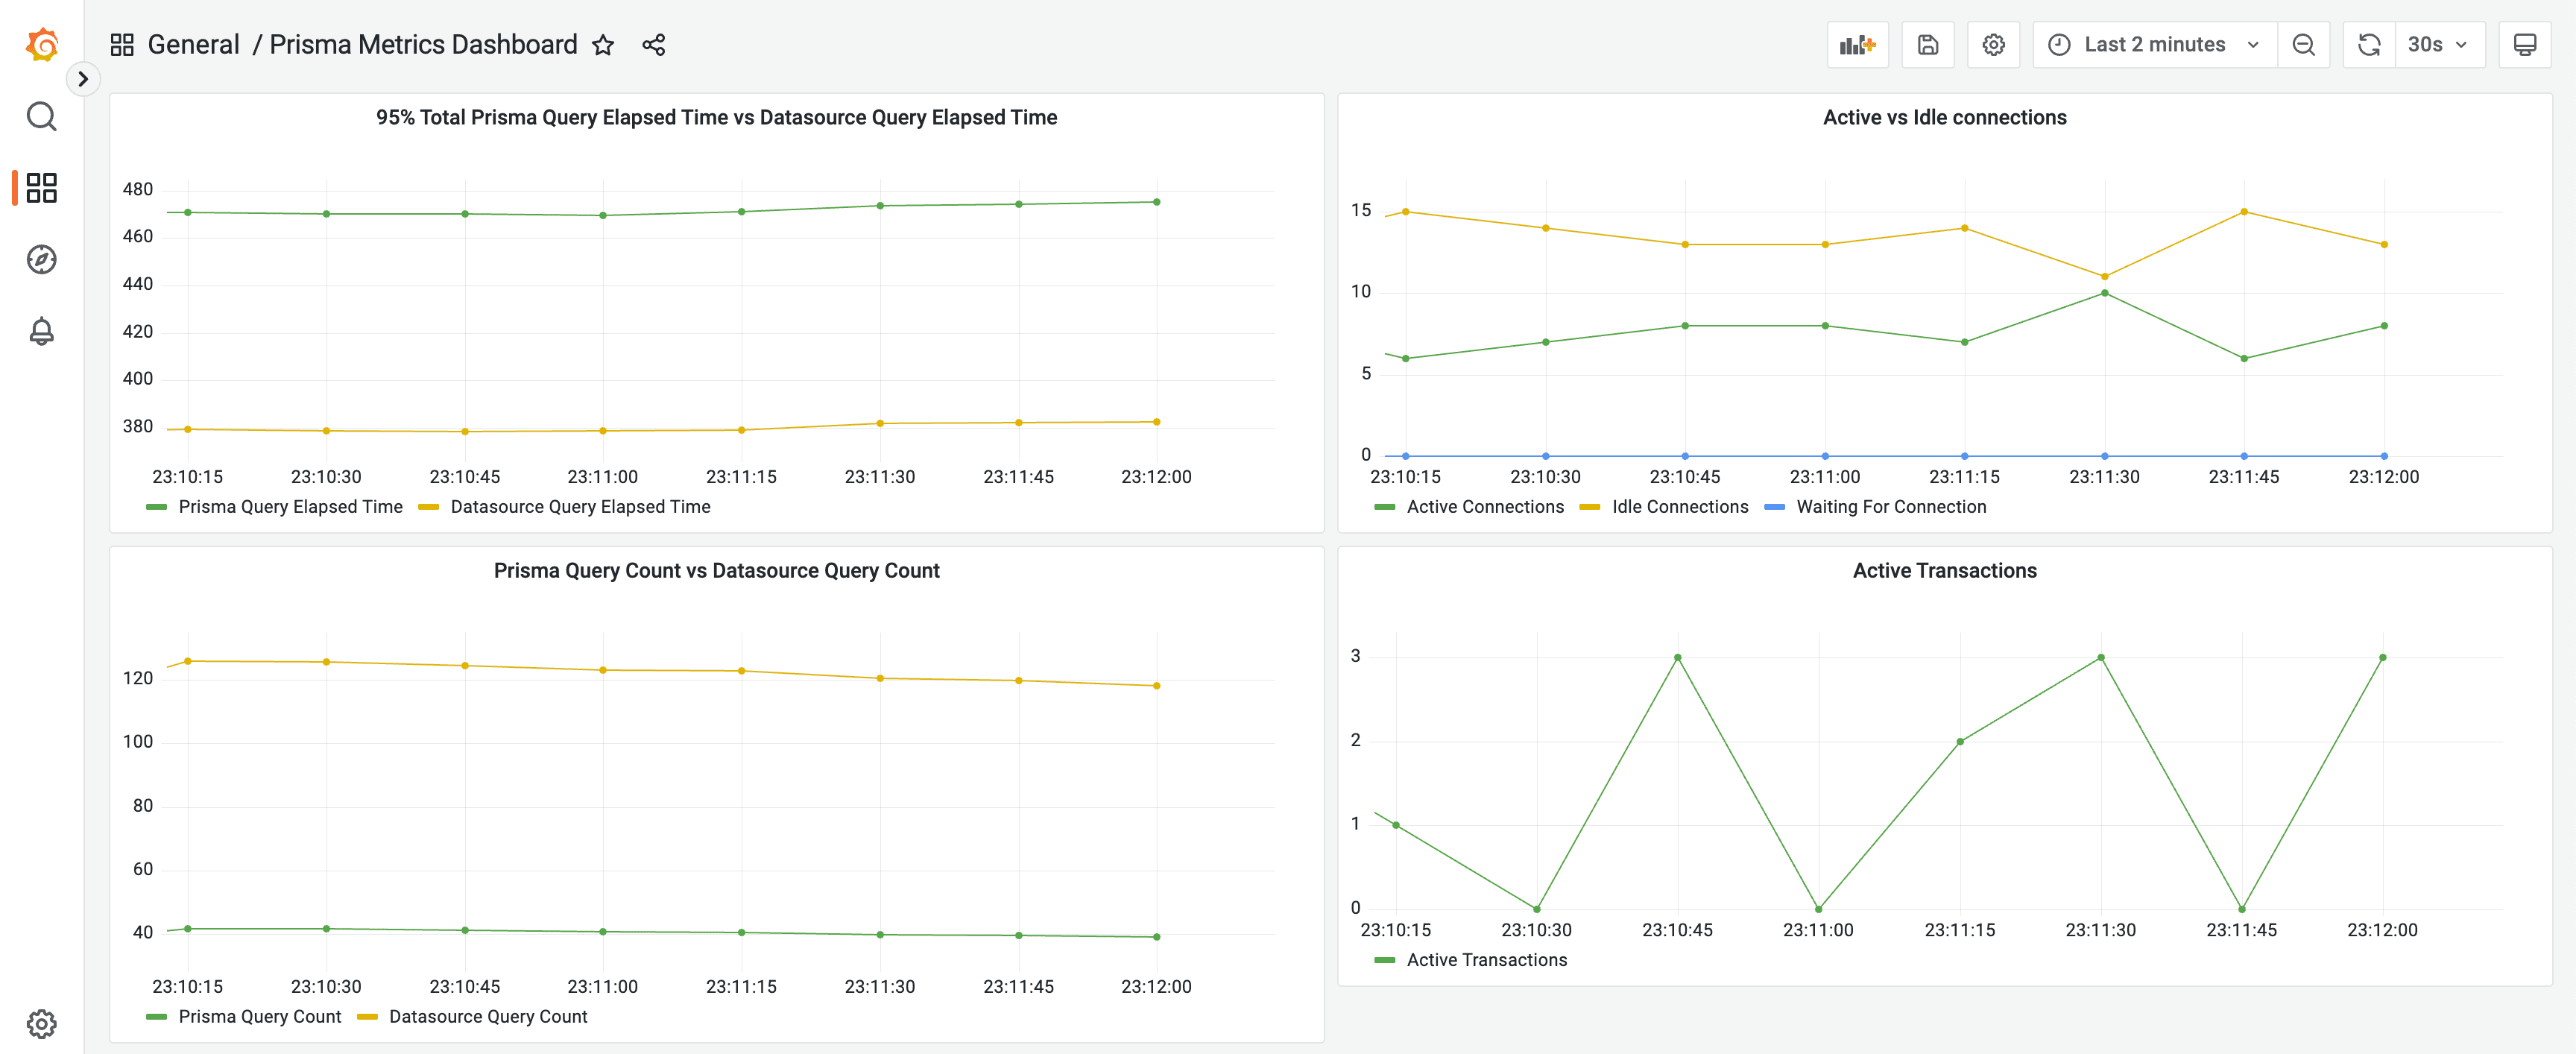
In summary, metrics can help you analyze and monitor the health of your application. It also helps identify performance issues and misconfigurations, so you can quickly take necessary action.
To get started with metrics, check out the metrics docs.
Tracing vs Metrics — When to use what?
Tracing is helpful for getting fine-grained information about the lifecycle of each operation. Tracing is especially valuable in distributed environments, where a single request can pass through multiple services.
If you want aggregated numerical data for monitoring the health and performance of your application, then consider using metrics.
It's also important to note that tracing and metrics are complementary features. They can be used together to improve the observability of your system.
Get started with tracing and metrics
To get started with tracing and metrics:
- See the tracing documentation and tracing tutorial.
- See the metrics documentation and metrics tutorial.
Share your feedback
We are eager to hear from you! Try out these features and let us know what you think.
📊 Share your feedback on tracing.
📈 Share your feedback on metrics.
🚀 If you plan to use these features for mission critical applications, please contact us to discuss your use case.
Keep reading

Prisma Next Early Access: Write Your Contract, Prompt Your Agent, Ship Your App
Prisma Next is open for Early Access. Define your data layer as a contract and the framework handles migrations, type-safe queries, and continuous upgrades, safe to delegate to your agent.


Prisma Next: April Milestone Complete, the Extension API Is Open
April shipped the first four extensions on the new Prisma Next extension API: pgvector, arktype-json, ParadeDB, and CipherStash. The extension API is open to outside authors. May shifts to Early Access.
Build your next app with Prisma
Start free. Scale when you’re ready.